STATISTICS WITH R
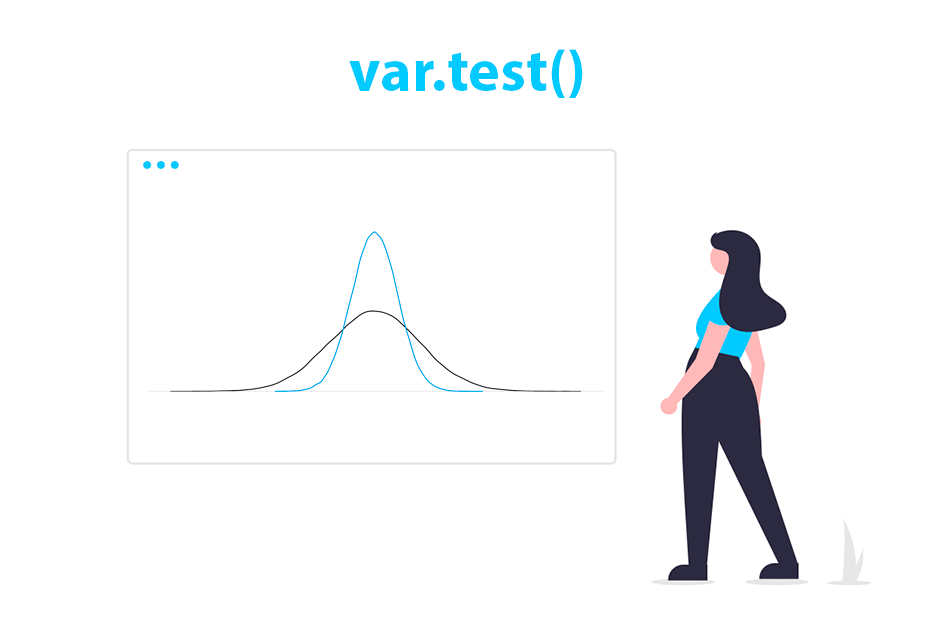
F test with var.test() to compare two variances
Hypothesis testing

T-test to compare means
Hypothesis testing

Shapiro Wilk normality test
Hypothesis testing

Quantiles
Location measures
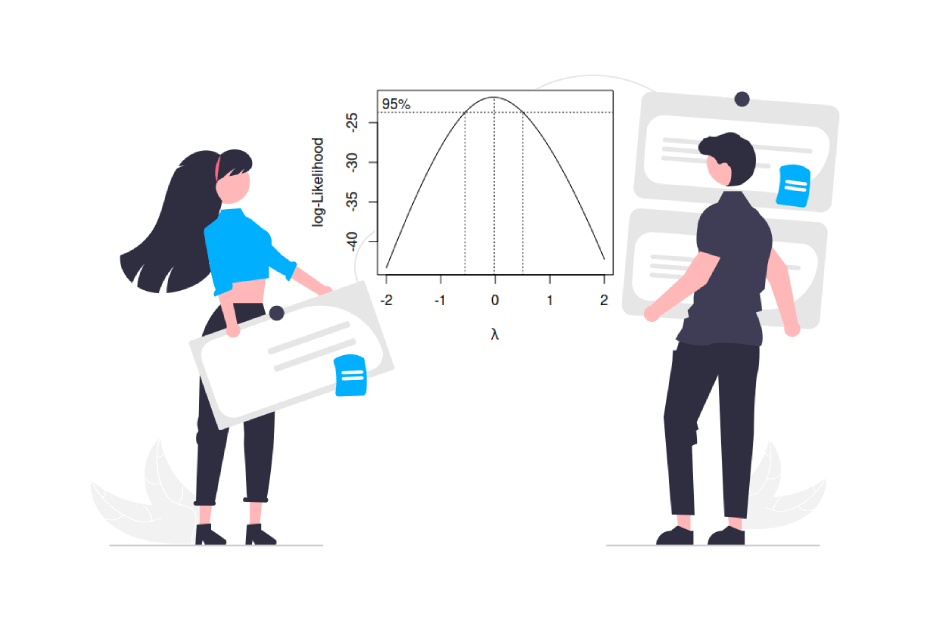
Box Cox transformation
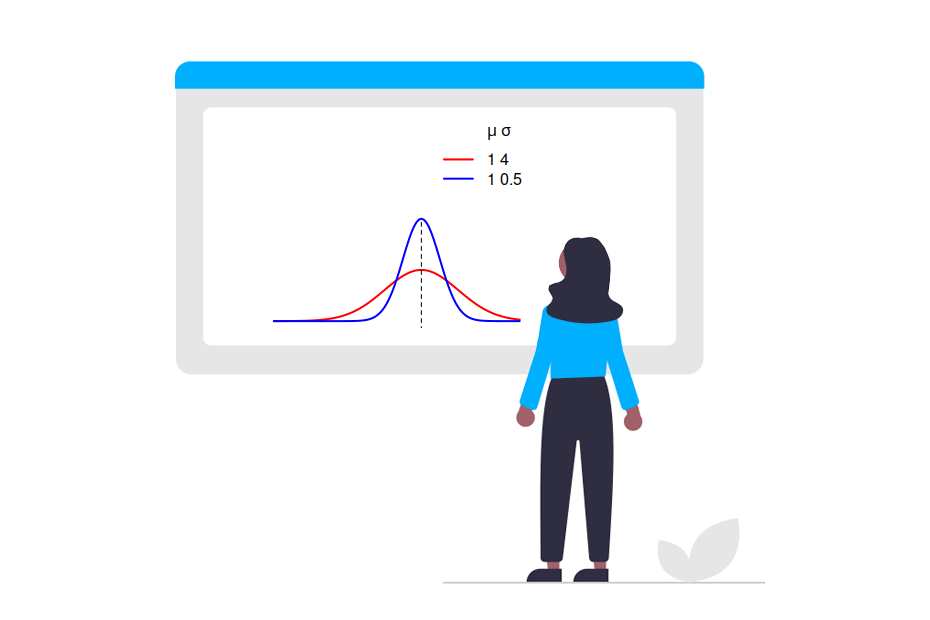
Variance and standard deviation
Dispersion measures

Calculate the mean
Measures of central tendency
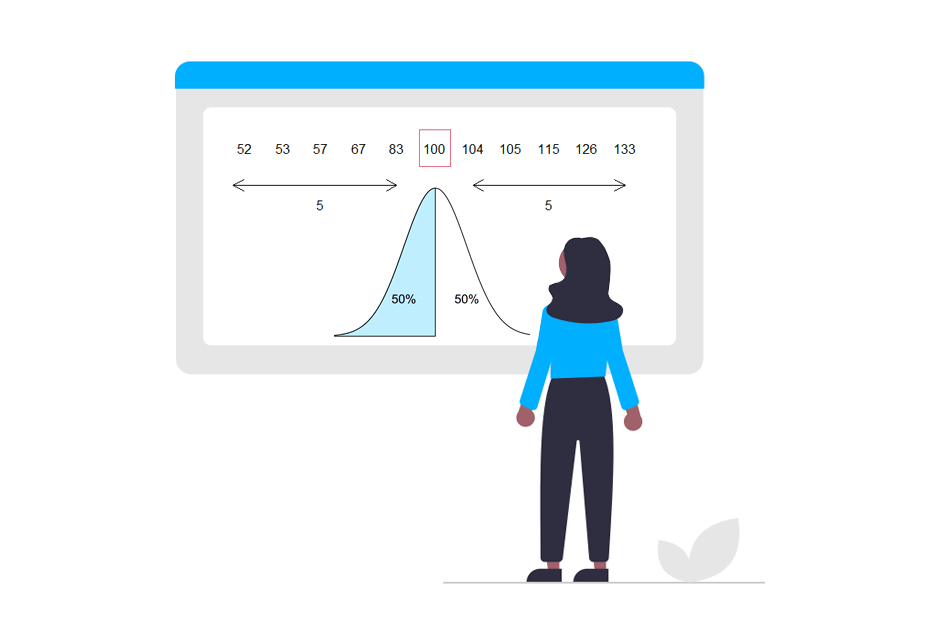
Calculate the median
Measures of central tendency
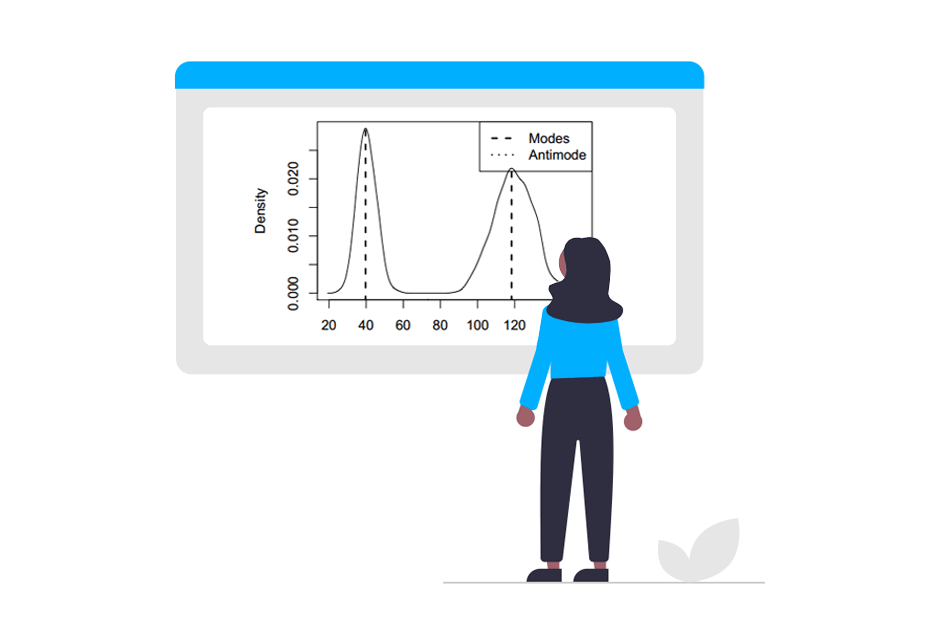
Mode estimation
Measures of central tendency
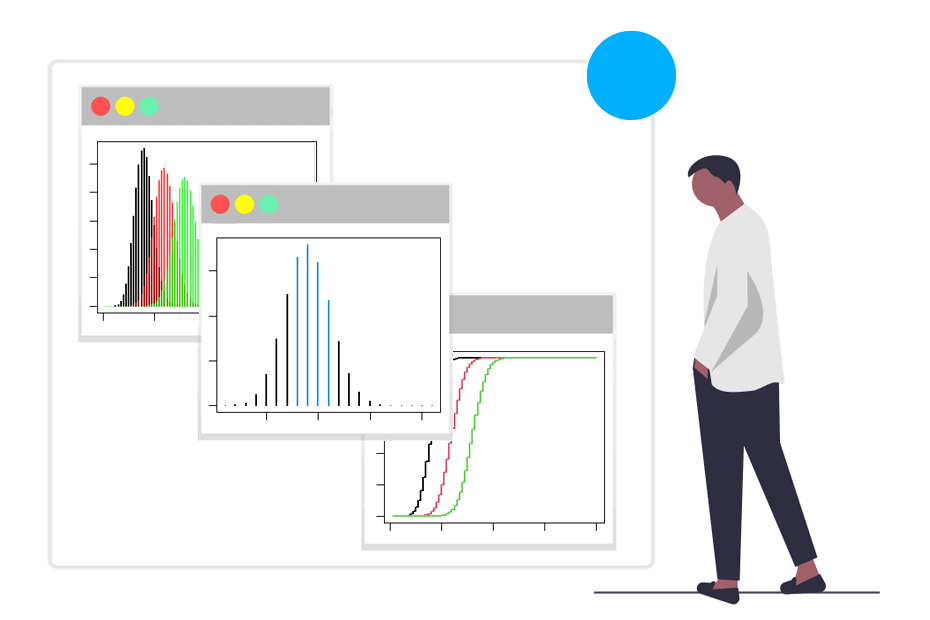
Binomial distribution
Distributions
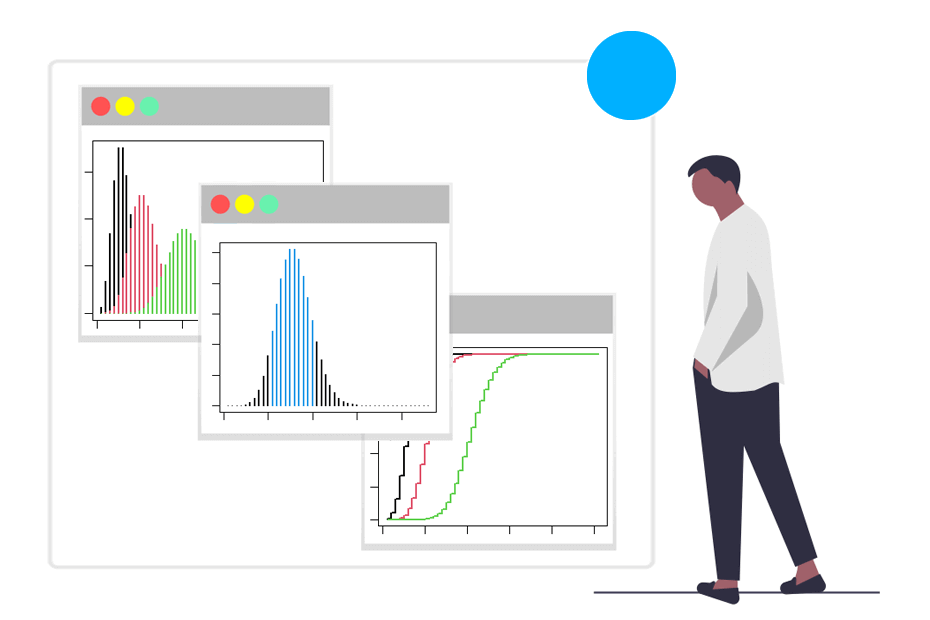
Poisson distribution
Distributions
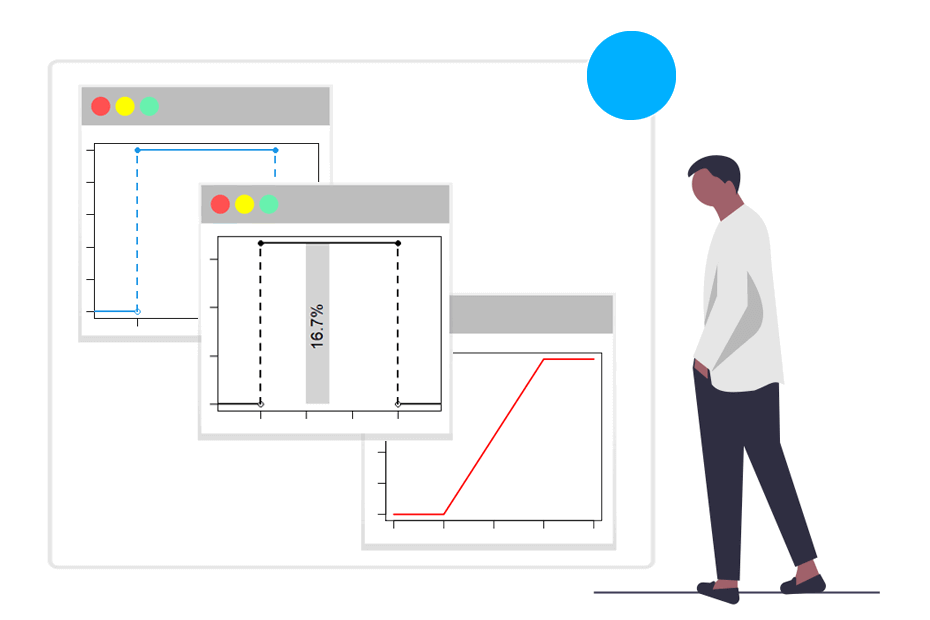
Continuous uniform distribution
Distributions
WHAT ARE THE KEY ADVANTAGES OF USING R FOR STATISTICAL ANALYSIS?
Statistics in R encompass a broad spectrum of functionalities and packages designed to perform various statistical analyses, data exploration, hypothesis testing and modeling tasks. R is extensively used in data analysis, academia, industry, scientific research and statistical computing due to its rich set of statistical tools and packages. Some key statistical functionalities in R include:
-
Descriptive Statistics
R offers functions to compute basic descriptive statistics such as mean, median, standard deviation, variance, range, quartiles, percentiles, and summary statistics for data exploration (summaryfunction). -
Hypothesis testing
R provides functions for conducting various statistical tests, including t-tests (t.test), chi-square tests (chisq.test), ANOVA (aov), F-tests (var.test), and non-parametric tests (such aswilcox.testorkruskal.test). -
Probability distributions
R includes a wide array of functions to work with probability distributions (e.g., normal, uniform, binomial, Poisson) for generating random numbers, calculating probabilities, quantiles, and density functions.