DESCRIPTIVE STATISTICS IN R
Descriptive statistics in R refers to the process of summarizing, organizing and describing a data set to understand its fundamental characteristics and patterns
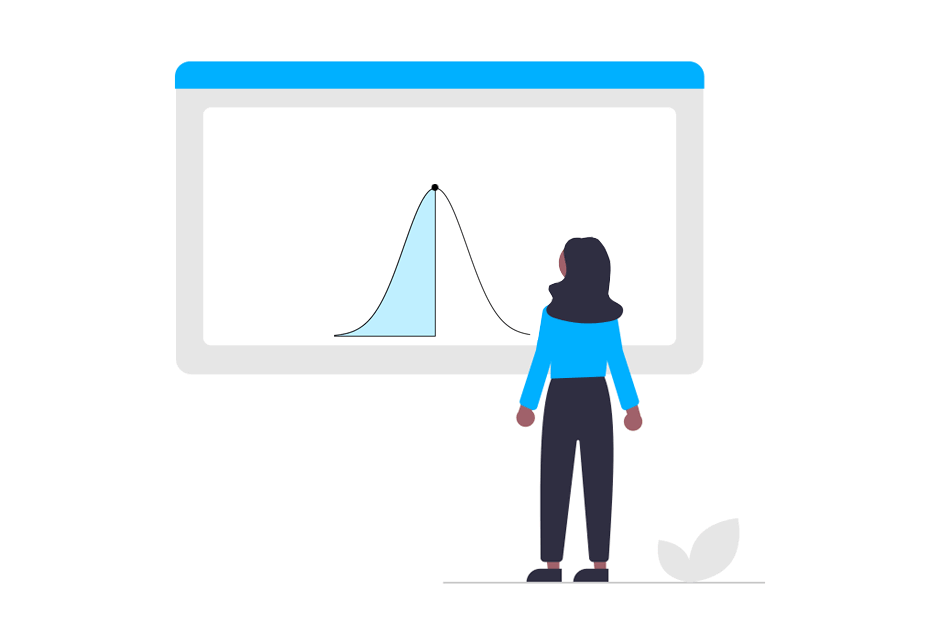
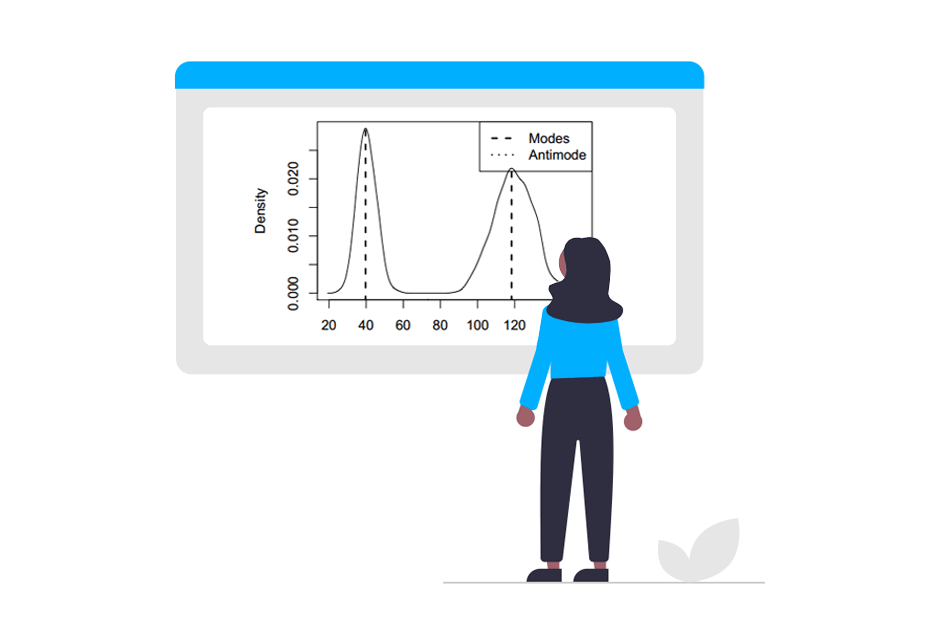
MEASURES OF CENTRAL TENDENCY
Measures of central tendency are descriptive statistics used to summarize or represent the central or typical value of a data set
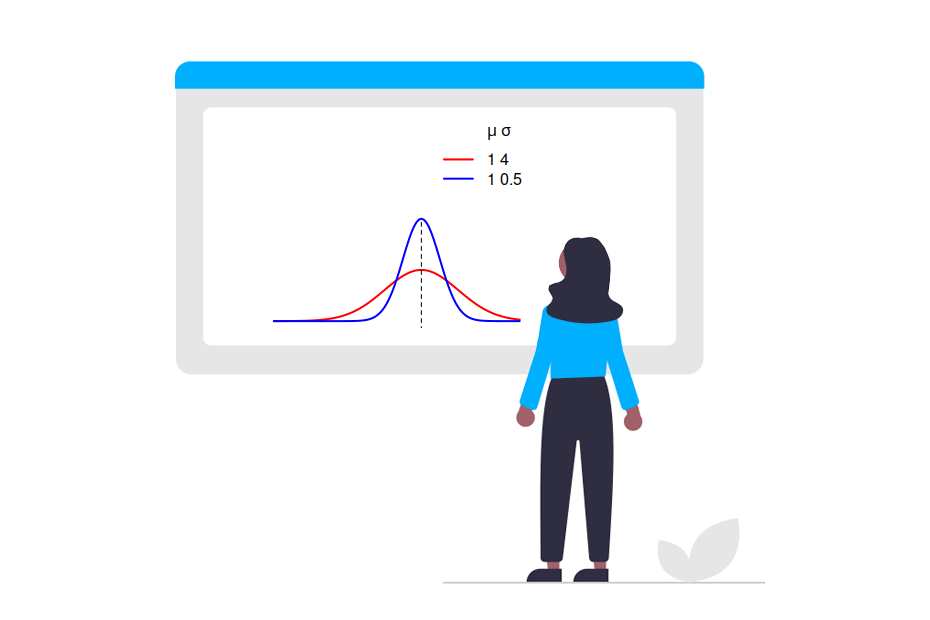
DISPERSION MEASURES
Measures of dispersion, also known as measures of variability, are statistical metrics used to quantify the extent to which the values in a data set differ or disperse from the central tendency (such as mean, median or mode)

Range
range() extendrange()
Variance and standard deviation
var() sd()

Coefficient of variation
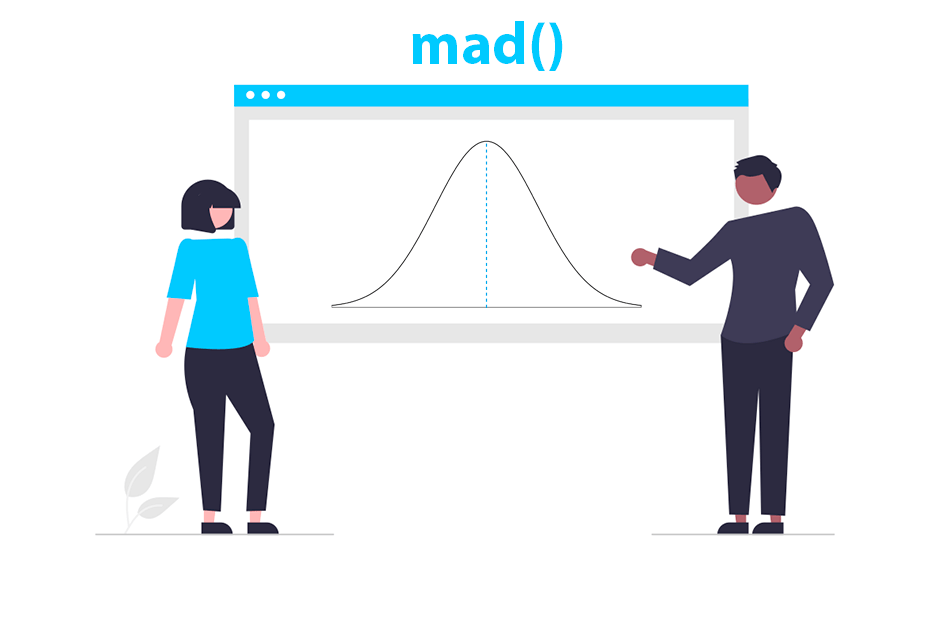
Median absolute deviation
mad()
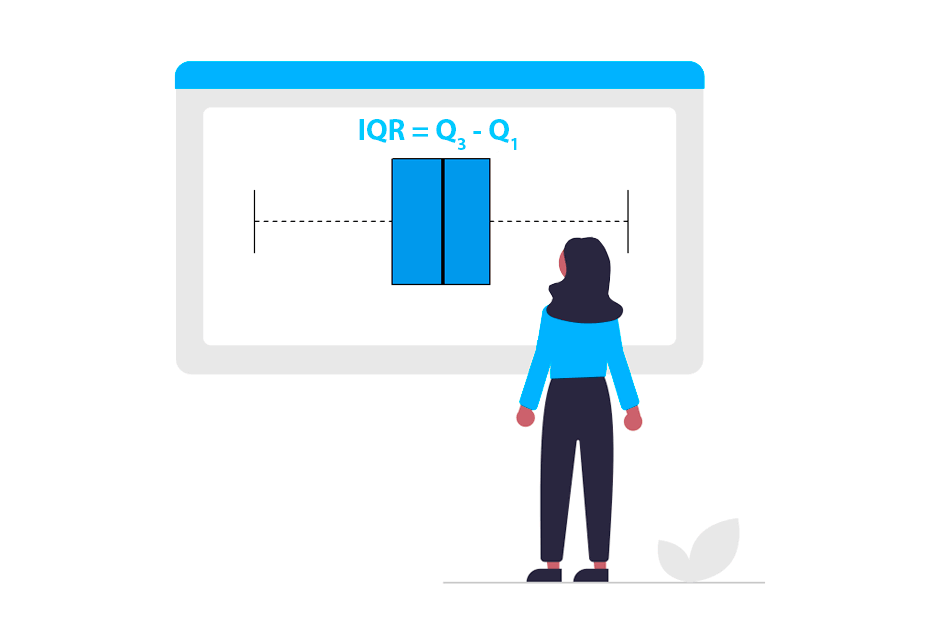
Interquartile range
IQR()
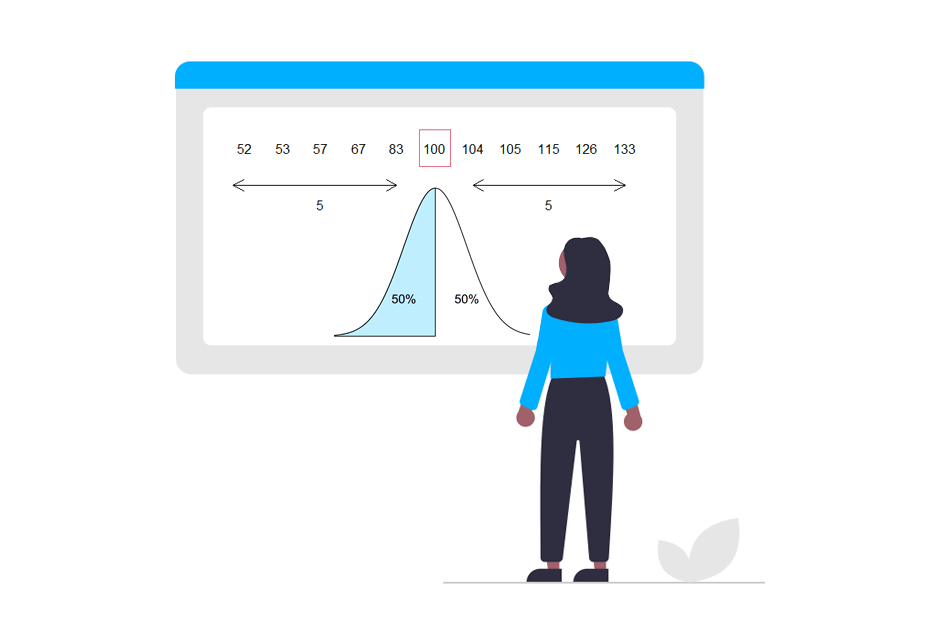
POSITION MEASURES
Position measures in statistics are tools that help to locate or identify the position of a particular value within a set of ordered data. These measures are used to understand how the data are distributed and how a specific value is related to the rest of the available information

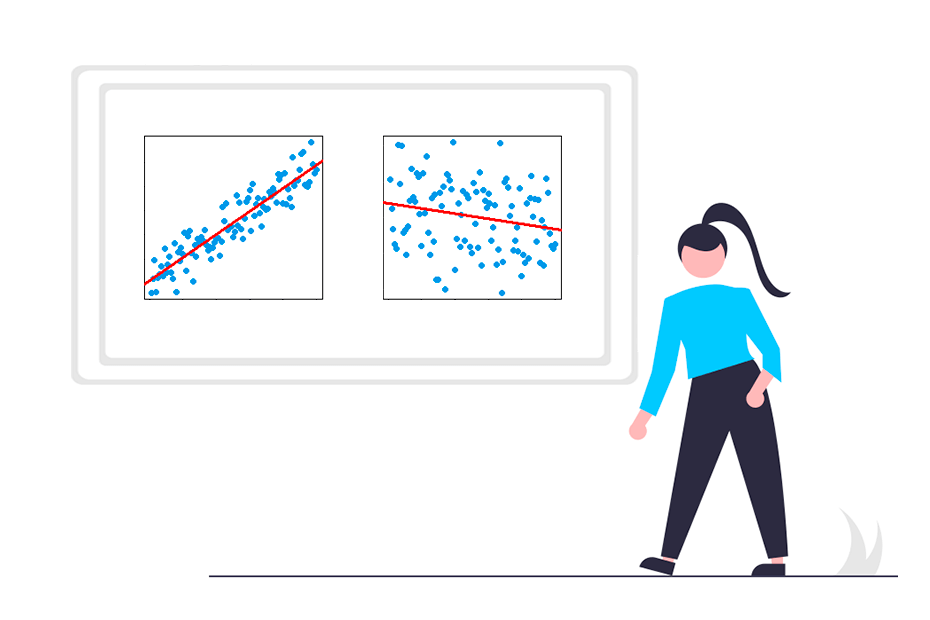
MEASURES OF ASSOCIATION
Measures of association in statistics are used to quantify and describe the relationship or association between two variables in a data set. These measures allow to understand how two variables behave or change together and to assess the strength and direction of that relationship
Covariance
cov()
Pearson's correlation coefficient
cor()
Kendall's tau correlation coefficient
cor()
Spearman's rho correlation coefficient
cor()
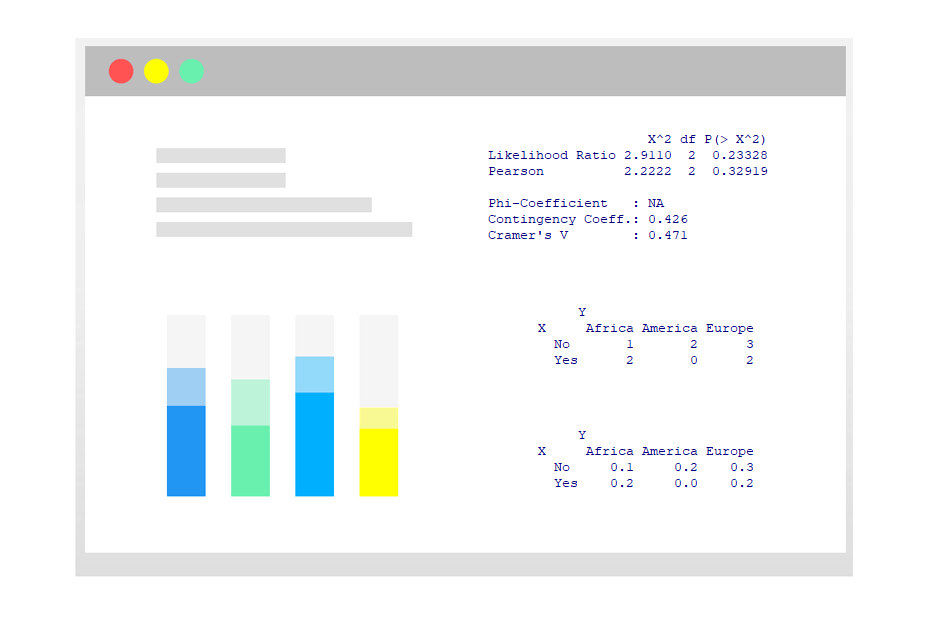
Contingency tables
table() prop.table()
GRAPHICAL REPRESENTATIONS
There are several graphical representations used in statistics to visualize and communicate the information contained in a set of data. Check the graphics section for all tutorials