Shapiro Wilk normality test in R

The Shapiro Wilk test is a test used to check the normality of the data, specially for small data sets with 50 samples or less. In R, the shapiro.test function performs this test for a numeric vector of values.
Hypothesis
The Shapiro-Wilk test checks for normality of the data. The null hypothesis (\(H_0\)) is that the distribution of the population is normal, while the alternative hypothesis is that the distribution of the population is not normal:
- \(H_0\): The distribution of the population is normal.
- \(H_1\): The distribution of the population is NOT normal.
The Shapiro-Wilk test is recommended for small data sets, when the sample size is 50 or less. For larger data sets it is recommended to use the Kolmogorov-Smirnov test.
Check for normality and interpretation
Example with non-normal data
Consider a sample data set with 30 values drawn from an exponential distribution:
# Sample data
set.seed(3)
x <- rexp(30)

# Histogram and density
hist(x, freq = FALSE, col = "white")
lines(density(x), lwd = 2, col = "red")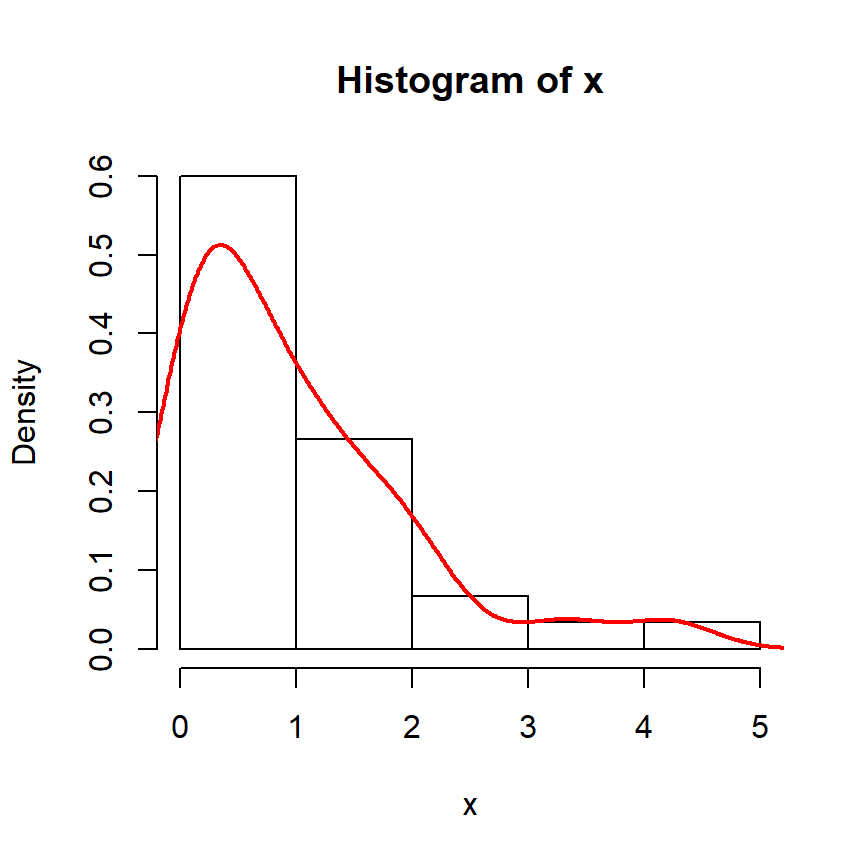
If you want to check if your data is normal you can input your data to the shapiro.test function, as shown below.
# Sample data
set.seed(3)
x <- rexp(30)

# Shapiro-Wilk test
shapiro.test(x)
Shapiro-Wilk normality test
data: x
W = 0.83304, p-value = 0.0002792The function will return a formatted list of class "htest" with the name of your data, the value of the Shapiro-Wilk statistic (W) and the p-value.
In order to interpret the result you need to compare the p-value with a significance level (\(\alpha\)) which is a threshold to determine if a test is statistically significant or not. Significance levels usually are 0.1 (for 90% of confidence), 0.05 (for 95% of confidence), 0.01 (for 99% percent of confidence).
As the p-value (0.000279) is lower than the usual significance levels (0.1, 0.05, and 0.01) we reject the null hypothesis of normality.
If the p-value is lower than \(\alpha\) we reject \(H_0\) for the selected level of significance.
Example with normal data
Now, consider some sample data drawn from a normal distribution:
# Sample data
set.seed(5)
x <- rnorm(30)

# Histogram and density
hist(x, freq = FALSE, col = "white")
lines(density(x), lwd = 2, col = "red")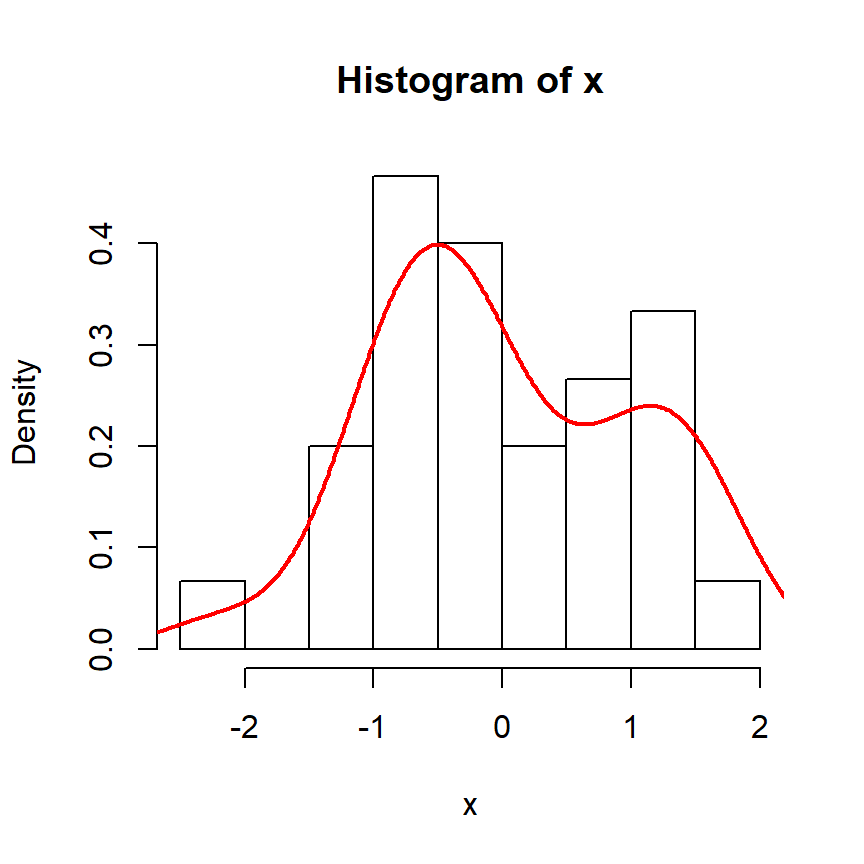
If you apply the Shapiro-Wilk test for this data you will get the following output:
# Sample data
set.seed(5)
x <- rnorm(30)

# Shapiro-Wilk test
shapiro.test(x)
Shapiro-Wilk normality test
data: x
W = 0.95084, p-value = 0.178The p-value is 0.178, greater than the usual significance levels (0.1, 0.05, and 0.01), so we don’t have enough evidence to reject the null hypothesis of normality.