Quantiles in R

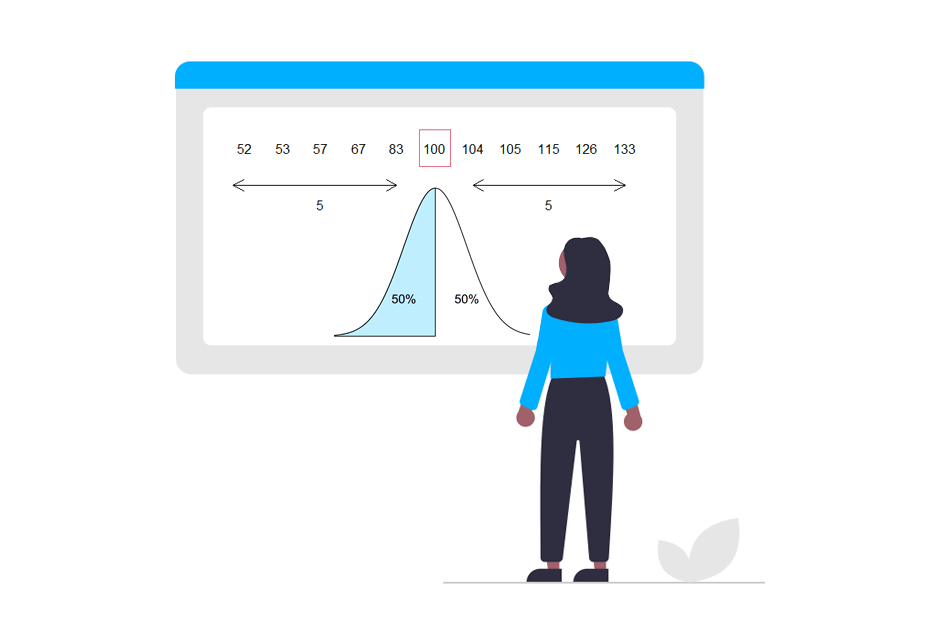
Considering a value \(p\), being \(0 < p < 1\) the quantile of order \(p\) is the value that leaves a proportion of the data below (\(p\)) and the rest \((1-p)\) above that value. Notice that quantiles are the generalization of the median which is the quantile for \(p = 0.5\). In R, you can make use of the quantile function to calculate any quantile for any numeric vector.
Syntax
The quantile function calculates the sample quantiles of a numeric vector (x). By default, this function calculates the quartiles specified inside probs, but you can also input any other probabilities to compute any percentile.
quantile(x,             # Numeric vector
         probs = seq(0, 1, 0.25), # Quantiles (By default the quartiles: 0, 0.25, 0.5, 0.75, 1)
         na.rm = FALSE, # If TRUE, removes missing values
         names = TRUE,  # If TRUE, the result keeps name attributes
         type = 7,      # Integer between 1 and 9 to select a quantile algorithm
         digits = 7,    # If names = TRUE, is the number of digits of the percentages
         ...)           # Additional arguments if needed
Quartiles
Quartiles are quantiles of order 0.25, 0.5 and 0.75 and they divide the sample into four parts with the same frequency. Usually, quartiles are denoted by \(Q_1\), \(Q_2\) and \(Q_3\).
# Sample data
set.seed(1)
x <- rnorm(100)

# Calculate the quartiles of x
quantile(x)
0% 25% 50% 75% 100%
-2.2146999 -0.4942425 0.1139092 0.6915454 2.4016178 Recall that the quartile 0.5 is equal to the median:
# Sample data
set.seed(1)
x <- rnorm(100)

# Calculate the median of x
median(x) # 0.1139092
Note that you can remove the name attributes from the output setting names = FALSE.
# Sample data
set.seed(1)
x <- rnorm(100)

# Calculate the quartiles of x
quantile(x, names = FALSE)
-2.2146999 -0.4942425 0.1139092 0.6915454 2.4016178Remove missing values
If your numeric vector contains missing values you won’t be able to calculate the quantiles, so you will need to set na.rm = TRUE to remove the missing values before the calculation.
# Sample data
set.seed(1)
x <- rnorm(100)

# Missing value
x[1] <- NA

# Calculate the quartiles of x removing missing values
quantile(x, na.rm = TRUE)
0% 25% 50% 75% 100%
-2.2146999 -0.4757753 0.1532533 0.6933514 2.4016178 Quantile algorithms
The calculation of the quantiles are based on one of the nine algorithms discussed in Hyndman and Fan (1996). By default, the seventh algorithm is used, but you can select other passing an integer between 1 and 9 to type. Read the previous reference for further information about each algorithm.
# Sample data
set.seed(1)
x <- rnorm(100)

# Calculate the quartiles of x using Type 8 algorithm
quantile(x, type = 8)
0% 25% 50% 75% 100%
-2.2146999 -0.5156992 0.1139092 0.6939534 2.4016178 Visual representation
It is important to note that a box plot can be used to visualize quartiles, but the method used inside the boxplot function is not the same as the one used inside quartile, so the output may vary slightly.
# Sample data
set.seed(1)
x <- rnorm(100)

quartile <- quantile(x)

# Box plot
boxplot(x, col = 4, horizontal = TRUE)
text(quartile[2], 1.25, expression(Q[1]))
text(quartile[3], 1.25, expression(Q[2]))
text(quartile[4], 1.25, expression(Q[3]))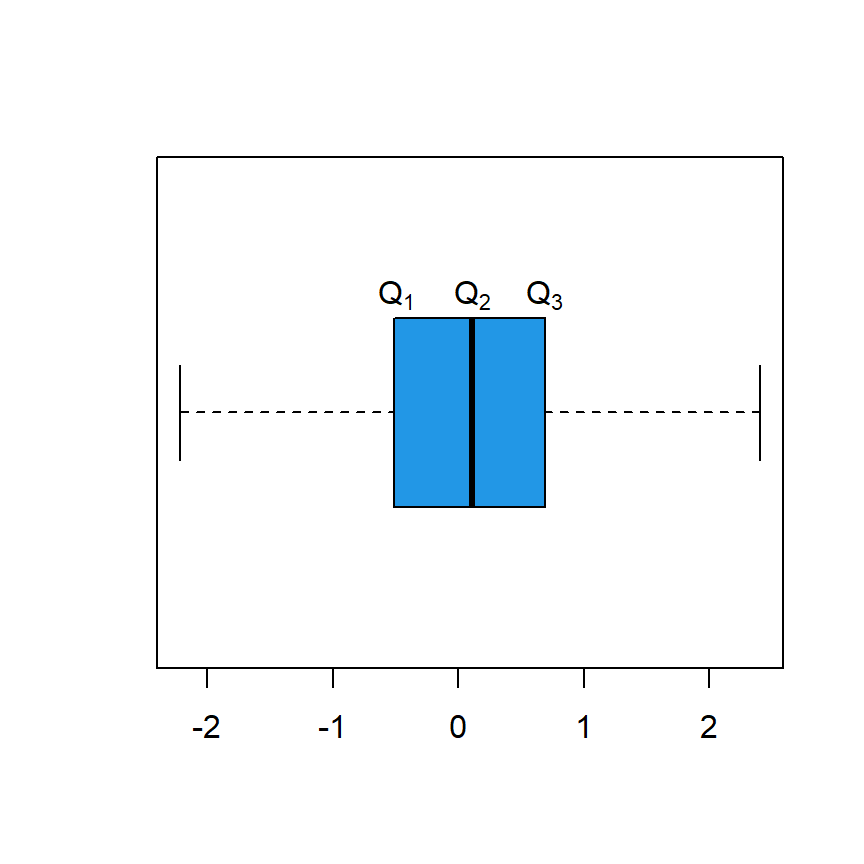
Deciles
Deciles are quantiles of order 0.1, 0.2, …, 0.9 and divide the sample into 10 equal-frequency parts. In order to calculate them you can input a sequence from 0 to 1 by 0.1 to probs, as shown in the example below.
# Sample data
set.seed(1)
x <- rnorm(100)

# Calculate the deciles of x
quantile(x, probs = seq(0, 1, by = 0.1))
0% 10% 20% 30% 40% 50% 60% 70% 80% 90% 100%
-2.21469989 -1.05265747 -0.61386923 -0.37534202 -0.07670313 0.11390916 0.37707993 0.58121734 0.77125360 1.18106508 2.40161776Percentiles
Percentiles are quantiles of the order 0.01, 0.02, … , 0.99 and divide the sample into 100 equal-frequency parts. If you want to calculate the percentiles of a numeric vector you will need to specify a sequence from 0 to 1 by 0.01 inside probs.
# Sample data
set.seed(1)
x <- rnorm(100)

# Calculate the percentiles of x
quantile(x, probs = seq(0, 1, by = 0.01))
0% 1% 2% 3% 4% 5% 6% 7% 8%
-2.214699887 -1.991605178 -1.808646490 -1.532008555 -1.472864961 -1.381744198 -1.282620249 -1.255240517 -1.226934278