F test in R with var.test() to compare two variances
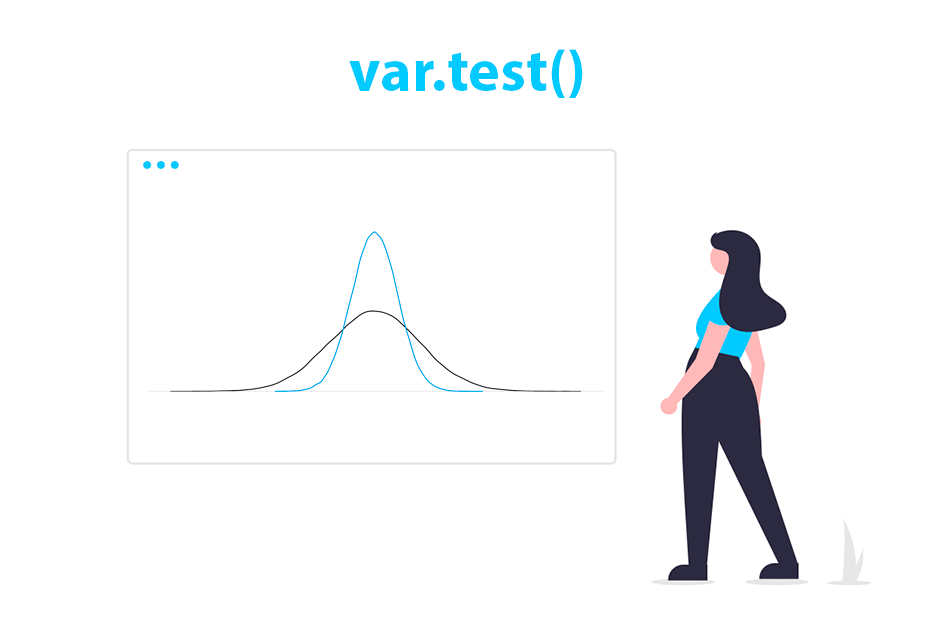
The var.test function in R is used to perform an F test to compare the variances of two samples. This statistical test evaluates whether the variances of two populations are equal or not.
Syntax
The syntax of the var.test function is the following:
var.test(x, y, ratio = 1,
         alternative = c("two.sided", "less", "greater"),
         conf.level = 0.95, ...)

# Method for class 'formula'
var.test(formula, data, subset, na.action, ...)
Being:
x,y: the samples or numerical vectors to be compared for the variance test.ratio: the ratio of variances under the null hypothesis. By default, it is 1 (indicating equality of variances).alternative: character string indicating the alternative hypothesis. Possible values are"two.sided"(default),"less"or"greater"....: further arguments.
This function returns the F-test statistics (F), the degrees of freedom of the numerator (num df) and denominator (denom df), the p-value, the alternative hypothesis, the confidence interval for the ratio of variances and the sample estimate for the ratio of variances.
The F-test assumes that the observations are drawn from two independent normal distributions \(X\) and \(Y\).
Equal variances
The null and alternative hypothesis on the test for equal variances are the following:
- \(H_0\): the variance of X IS EQUAL to the variance of \(Y\).
- \(H_1\): the variance of X IS NOT EQUAL to the variance of \(Y\).
Consider that you want to test if the variances of two variables named x and y are equal, or in other words, that the ratio between the variances is one. For this purpose, you can input the variables to the var.test function as in the example below.
# Sample data
set.seed(11)
x <- rnorm(100)
y <- rnorm(100)

# ¿Is the variance of 'x' equal to the variance of 'y'?
var.test(x = x, y = y)

# Equivalent to:
# df <- data.frame(vars = c(x, y), groups = c(rep("G1", 100), rep("G2", 100)))
# var.test(vars ~ groups, data = df)
F test to compare two variances
data: x and y
F = 0.86821, num df = 99, denom df = 99, p-value = 0.4833
alternative hypothesis: true ratio of variances is not equal to 1
95 percent confidence interval:
0.584168 1.290363
sample estimates:
ratio of variances
0.8682101 The conclusion drawn from the test is that, based on the p-value (0.4833), there isn’t sufficient evidence to reject the null hypothesis of equal variances, as it is greater than the usual significance levels. In addition, the 95 percent confidence interval for the ratio of variances is calculated as (0.584168, 1.290363), which includes the value 1. This indicates that at a 95 percent confidence level, the ratio of variances could plausibly be equal to 1. The sample estimate for the ratio of variances is 0.862101.
By default, when ratio = 1, the function conducts a test for equal variances. To perform tests with other variance ratios, you can specify other values.
Lower variance
When alternative = "less", the alternative hypothesis is that the variance of X is lower than the variance of Y, this is:
- \(H_0\): the variance of X IS EQUAL to the variance of \(Y\).
- \(H_1\): the variance of X IS LOWER THAN the variance of \(Y\).
Consider the following example where the variance of y is greater than the variance of x:
# Sample data
set.seed(11)
x <- rnorm(100)
y <- rnorm(100, sd = 5)

# ¿Is the variance of 'x' lower than the variance of 'y'?
var.test(x = x, y = y, alternative = "less")
F test to compare two variances
data: x and y
F = 0.034728, num df = 99, denom df = 99, p-value < 2.2e-16
alternative hypothesis: true ratio of variances is less than 1
95 percent confidence interval:
0.00000000 0.04841352
sample estimates:
ratio of variances
0.03472841 The p-value is almost 0, which implies that there is strong evidence to reject the null hypothesis of equal variances. In addition, the 95 percent confident interval ranges from 0 to 0.04841352, so the ratio of variances is plausibly between these two values, further supporting the conclusion that the variance of X is significantly less than the variance of Y.
Greater variance
The last possible alternative hypothesis is that the variance of X is greater than the variance of Y:
- \(H_0\): the variance of X IS EQUAL to the variance of \(Y\).
- \(H_1\): the variance of X IS GREATER THAN the variance of \(Y\).
Considering the same data as in the previous example we have the following:
# Sample data
set.seed(11)
x <- rnorm(100)
y <- rnorm(100, sd = 5)

# ¿Is the variance of 'x' greater than the variance of 'y'?
var.test(x = x, y = y, alternative = "greater")
F test to compare two variances
data: x and y
F = 0.034728, num df = 99, denom df = 99, p-value = 1
alternative hypothesis: true ratio of variances is greater than 1
95 percent confidence interval:
0.02491168 Inf
sample estimates:
ratio of variances
0.03472841The F-test results in a p-value of 1, indicating no statistical evidence to reject the null hypothesis of equal variances. Moreover, the 95 percent confidence interval ranges from 0.02491168 to \(\infty\), including the value 1. This suggests inconclusive evidence that the variance of X is greater than the variance of Y.