sapply function in R

What is sapply in R? The sapply function in R is a vectorized function of the apply family that allows you to iterate over a list or vector without the need of using the for loop, that is known to be slow in R. In this tutorial we will show you how to work with the R sapply function with several examples.
sapply() function
The sapply function in R applies a function to a vector or list and returns a vector, a matrix or an array. The function has the following syntax:
sapply(X,   # Vector, list or expression object
       FUN, # Function to be applied
       ..., # Additional arguments to be passed to FUN
       simplify = TRUE,  # If FALSE returns a list. If "array" returns an array if possible
       USE.NAMES = TRUE) # If TRUE and if X is a character vector, uses the names of X
In the following sections we will review how to use it with several examples
The examples of this tutorial are only for illustrative purposes to understand how to use the sapply function, as there are better ways to obtain the calculated results.
How to use sapply in R?
In order to use the sapply function in R you will need to specify the list or vector you want to iterate over on the first argument and the function you want to apply to each element of the vector in the second. Note that you can use a function of any package or a custom function:
sapply(1:4, sqrt)
# 1.000000 1.414214 1.732051 2.000000

# Equivalent to:
sapply(1:4, function(i) sqrt(i))

# Also equivalent to:
my_fun <- function(i) {
    sqrt(i)
}

sapply(1:4, my_fun)
Iterate over a vector
Consider, for instance, that you want to calculate the square of the elements of a vector. Using a for loop you will need to type the following code:
out <- numeric(10)

for (i in 1:10) {
    out[i] <- i ^ 2
}
out
1 4 9 16 25 36 49 64 81 100However, with the sapply function you can just write all in a single line of code in order to obtain the same output:
sapply(1:10, function(i) i ^ 2)1 4 9 16 25 36 49 64 81 100Iterate over a list
If you have a list instead of a vector the steps are analogous, but note that the function will be applied to the elements of the list. In the following example we calculate the number of components of each element of the list with the length function.
List <- list(A = 1:5, B = 6:20, C = 1)

sapply(List, length)
A B C
5 15 1sapply vs lapply
The difference between lapply and sapply functions is that the sapply function is a wrapper of the lapply function and it returns a vector, matrix or an array instead of a list.
Consider that you want to calculate the exponential of three numbers. In this case, if you use the sapply function you will get a vector as output:
sapply(c(3, 5, 7), exp)20.08554 148.41316 1096.63316But if you use the lapply function, you will get a list where each element correspond to the components of the previous vector.
lapply(c(3, 5, 7), exp)[[1]]
[1] 20.08554
[[2]]
[1] 148.4132
[[3]]
[1] 1096.633However, on the one hand, if you set the simplify argument of the sapply function to FALSE you will get the same output as the lapply function. Note that this is the same as using the as.list function:
sapply(c(3, 5, 7), exp, simplify = FALSE)
as.list(sapply(c(3, 5, 7), exp)) # Equivalent
[[1]]
[1] 20.08554
[[2]]
[1] 148.4132
[[3]]
[1] 1096.633On the other hand, you can convert the output of the lapply function to the same type of output of the sapply function with the simplify2array or unlist functions:
simplify2array(lapply(c(3, 5, 7), exp))
unlist(lapply(c(3, 5, 7), exp)) # Equivalent
To sum up, the sapply and lapply functions are almost the same, but differ on the output class.
It is more efficient to use the corresponding function instead of transforming the output.
sapply function with additional arguments
The sapply function in R allows you to pass additional arguments to the function you are applying after the function. Consider the following list with one NA value:
my_list <- list(A = c(1, 4, 6), B = c(8, NA, 9 , 5))If you apply the sum function to each element of the list it will return the sum of the components of each element, but as the second element contains a NA value the sum also returns NA.
sapply(my_list, sum) A B
11 NAAs the sum function has an additional argument named na.rm, you can set it to TRUE as follows to remove NA values:
sapply(my_list, sum, na.rm = TRUE)In consequence, the NA value is not taken into account and the function returns the sum of the finite values.
 A  B
11 22
It should be noted that if the function you are applying has more additional arguments you can specify them the same way, one after another.
Return a matrix or an array
The output of the sapply function in R can also be a matrix or an array. On the one hand, if the function you are applying returns vectors of the same length, the sapply function will output a matrix where the columns are each one of the vectors. On the other hand, if the function returns a matrix, the sapply function will treat, by default, the matrices as vectors, creating a new matrix, where each column corresponds to the elements of each matrix.
Consider, as an example, that you want to create matrices of three rows and three columns, where all elements have the same number. In order to create one you can type the following:
matrix(1, ncol = 3, nrow = 3) [,1] [,2] [,3]
[1,] 1 1 1
[2,] 1 1 1
[3,] 1 1 1However, if you try to use the sapply function to iterate over a list to create more matrices the output won’t be as expected, due to, as we pointed out before, the function treats each matrix as vectors by default.
sapply(1:3, function(i) matrix(i, ncol = 3, nrow = 3)) [,1] [,2] [,3]
[1,] 1 2 3
[2,] 1 2 3
[3,] 1 2 3
[4,] 1 2 3
[5,] 1 2 3
[6,] 1 2 3
[7,] 1 2 3
[8,] 1 2 3
[9,] 1 2 3In order to solve this issue you can set the simplify argument to "array" and consequently each element of the array will contain the desired matrix:
sapply(1:3, function(i) matrix(i, ncol = 3, nrow = 3), simplify = "array"), , 1
     [,1] [,2] [,3]
[1,]    1    1    1
[2,]    1    1    1
[3,]    1    1    1
, , 2
[,1] [,2] [,3]
[1,] 2 2 2
[2,] 2 2 2
[3,] 2 2 2
, , 3
[,1] [,2] [,3]
[1,] 3 3 3
[2,] 3 3 3
[3,] 3 3 3It is worth to mention that if you set simplify to FALSE you can output a list, where each element will contain the corresponding matrix. Note that this is the default behavior of the lapply function.
sapply(1:3, function(i) matrix(i, ncol = 3, nrow = 3), simplify = FALSE)[[1]]
[,1] [,2] [,3]
[1,] 1 1 1
[2,] 1 1 1
[3,] 1 1 1
[[2]]
[,1] [,2] [,3]
[1,] 2 2 2
[2,] 2 2 2
[3,] 2 2 2
[[3]]
[,1] [,2] [,3]
[1,] 3 3 3
[2,] 3 3 3
[3,] 3 3 3Multiple sapply: Nesting the sapply function
You can nest multiple sapply functions in R. Suppose that you want to iterate over the columns and rows of a data frame and multiply each element by two. For that purpose, using a for loop you could type:
df <- trees

res <- data.frame()

for(i in 1:ncol(df)) {
    for (j in 1:nrow(df)) {
        res[j, i] <- df[j, i] * 2
    }
}
Nonetheless, using the sapply function you can avoid loops. Write the following to achieve the same output:
sapply(1:ncol(df), function(i) {
       sapply(1:nrow(df), function(j) {
              df[j, i] * 2
       })
})
This example is only for educational purposes, as you could achieve the same result just with df * 2.
sapply function example: creating plots
Sometimes the number of lines or plots you want to display depends on something (as the number of variables of a data frame, for instance). In this case, you have to iterate over some list to show the final result. For that purpose you could use a for loop:
plot(rnorm(10), ylim = c(-6, 6))

nlines <- 5

for (i in 1:nlines) {
    lines(-i:i, col = i, lwd = 3)
}
Nevertheless, if you want to avoid using R for loops you can use the sapply function. Note that as we are applying a graphics function, the sapply function returns NULL but the invisible function will avoid showing the prints of the output.
plot(rnorm(10), ylim = c(-6, 6))

nlines <- 5

invisible(sapply(1:nlines, function(i) lines(-i:i, col = i, lwd = 3)))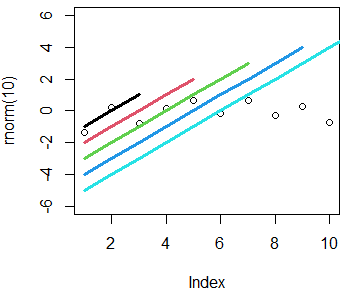
This is very useful when creating functions with S3 classes in R packages to draw graphs.