STATISTICS WITH R
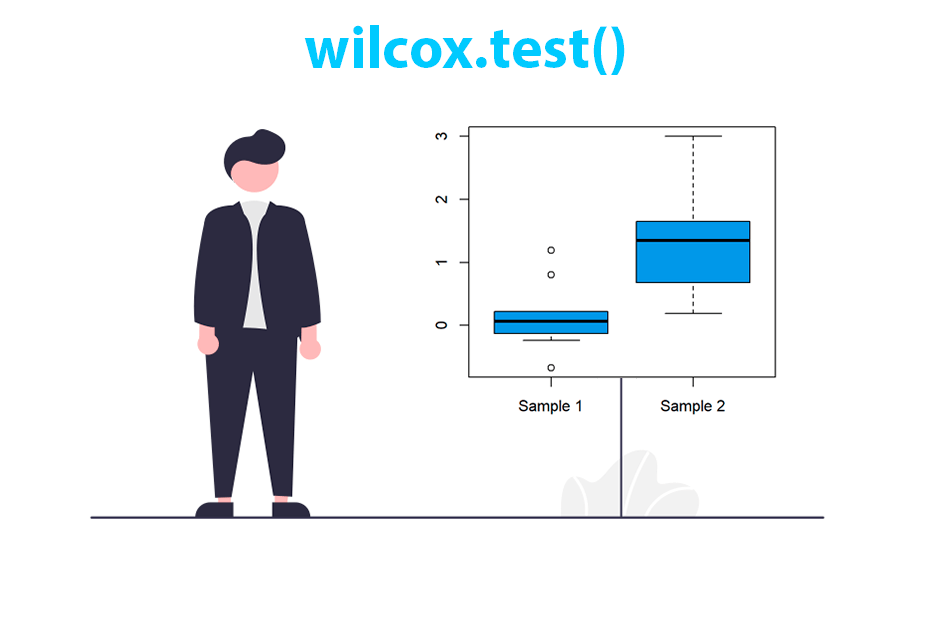
Wilcoxon tests with wilcox.test()
Hypothesis testing

Kolmogorov-Smirnov test with ks.test()
Hypothesis testing

Coefficient of variation
Dispersion measures

Range of values
Dispersion measures

Pearson's Chi-squared test with chisq.test()
Hypothesis testing

Random samples and permutations
Simulation

Interquartile range
Dispersion measures
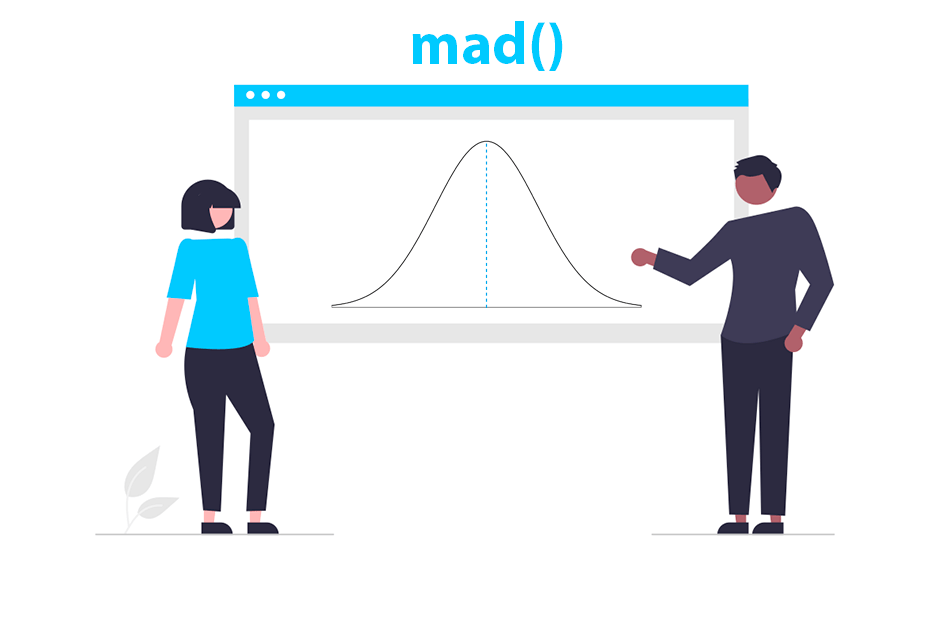
Median absolute deviation
Dispersion measures
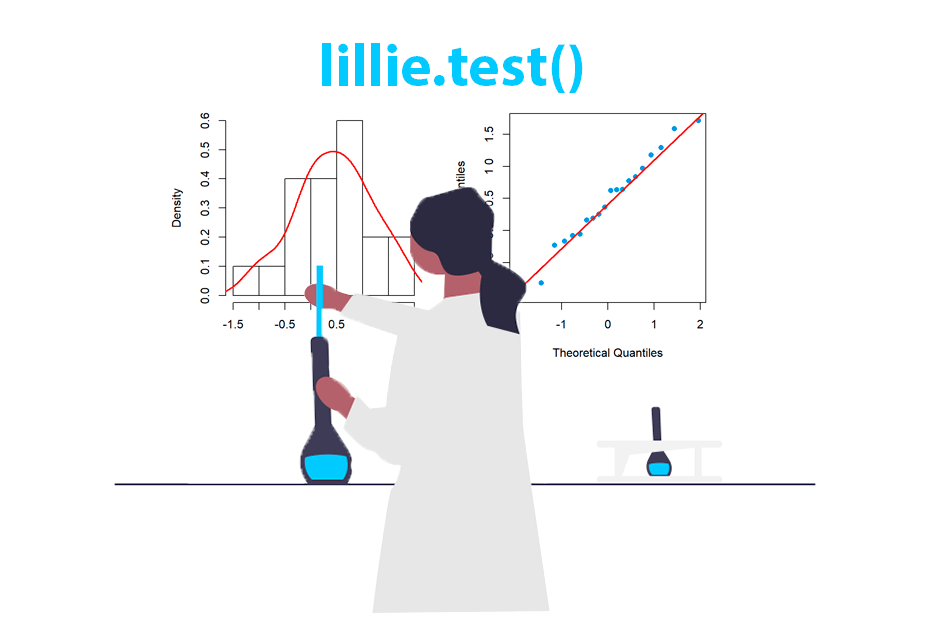
Lilliefors normality test
Hypothesis testing

Kruskal Wallis rank sum test (H test)
Hypothesis testing
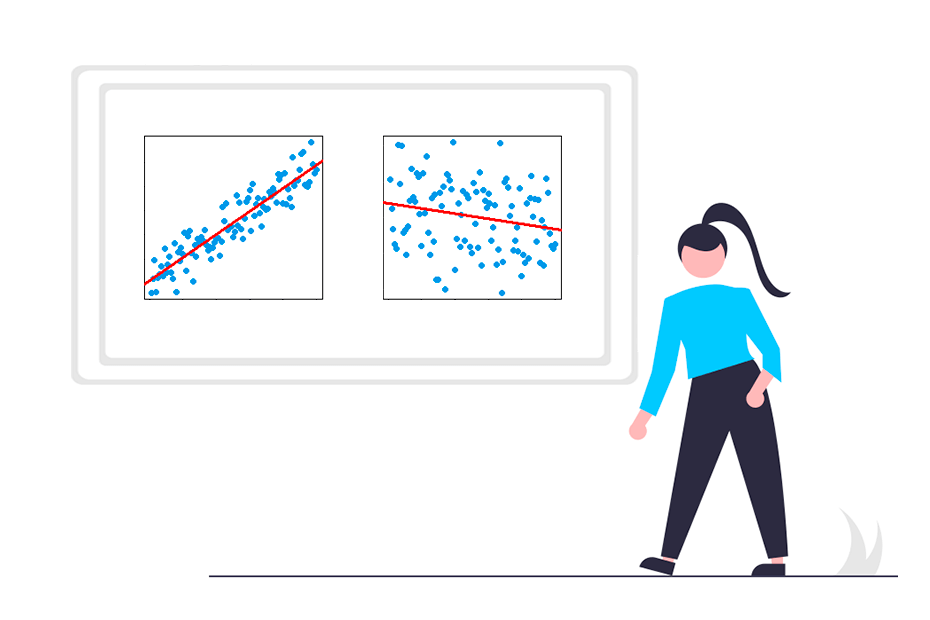
Covariance and correlation
Association measures
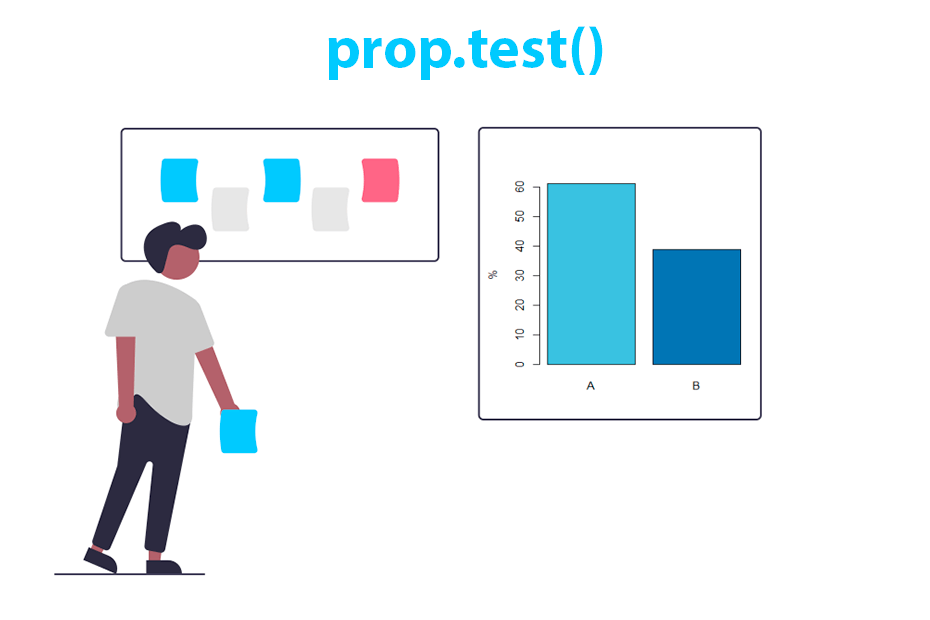
Test for proportions with prop.test()
Hypothesis testing
WHAT ARE THE KEY ADVANTAGES OF USING R FOR STATISTICAL ANALYSIS?
Statistics in R encompass a broad spectrum of functionalities and packages designed to perform various statistical analyses, data exploration, hypothesis testing and modeling tasks. R is extensively used in data analysis, academia, industry, scientific research and statistical computing due to its rich set of statistical tools and packages. Some key statistical functionalities in R include:
-
Descriptive Statistics
R offers functions to compute basic descriptive statistics such as mean, median, standard deviation, variance, range, quartiles, percentiles, and summary statistics for data exploration (summaryfunction). -
Hypothesis testing
R provides functions for conducting various statistical tests, including t-tests (t.test), chi-square tests (chisq.test), ANOVA (aov), F-tests (var.test), and non-parametric tests (such aswilcox.testorkruskal.test). -
Probability distributions
R includes a wide array of functions to work with probability distributions (e.g., normal, uniform, binomial, Poisson) for generating random numbers, calculating probabilities, quantiles, and density functions.