Wilcoxon tests in R with wilcox.test()
The wilcox.test function in R is used to perform the signed rank test (for comparing if the median of one sample is equal to a specific value and also paired samples test) and the Wilcoxon rank sum test (also known as the Mann-Whitney U test) for comparing two independent samples to assess whether their distributions are stochastically equal, greater or less than one another.
The Wilcoxon tests are non-parametric tests used when the data doesn’t meet the assumptions of parametric tests, such as normality.
The Kruskal-Wallis test is the generalization of the Wilcoxon test for \(k\) samples.
Syntax of wilcox.test
The wilcox.test function in R has the following syntax:
wilcox.test(x, y = NULL,
            alternative = c("two.sided", "less", "greater"),
            mu = 0, paired = FALSE, exact = NULL, correct = TRUE,
            conf.int = FALSE, conf.level = 0.95,
            tol.root = 1e-4, digits.rank = Inf, ...)
Being:
x: numeric vector of data values representing the first sample.y: (Optional) numeric vector of data values representing the second sample for a Mann-Whitney test. If not specified (NULL, by default), a one-sample Wilcoxon test is performed onx.alternative: alternative hypothesis. Possible values are"two.sided"(by default),"less"and"greater".mu: the hypothesized median (for one sample test) or median difference between the samples (for two samples test).paired: a logical indicating whether the samples represent paired data.exact: whether to compute an exact p-value. Possible values areTRUE,FALSEandNULL(default, where an exact p-value is computed for small to moderate-sized samples).correct: a logical indicating whether to apply continuity correction.conf.int: a logical indicating whether to compute confidence intervals.conf.level: ifconf.int = TRUEis the confidence level of the interval.tol.root: ifconf.int = TRUEis a numeric tolerance used in some calculations.digits.rank: number of significant digits to compute ranks.
Signed rank test
The Wilcoxon Signed-Rank test, is a non-parametric statistical test used to determine whether the median of a single sample significantly differs from a hypothesized median value (usually zero).
Median equal to a specific value
The null and alternative hypotheses in this scenario are the following:
- \(H_0\): the median of X IS \(\mu\).
- \(H_1\): the median of X IS NOT \(\mu\).
Being \(\mu\) the specific median value to be tested, which is usually zero.
Consider that you have the following data named x represented using a box plot:
# Sample data
x <- c(0.22, 1.05, -0.24, 0.18, 0.16, -0.67, 2.49, -0.07, -0.13, -0.03)

# Box plot
boxplot(x, col = 4, xlab = "Sample")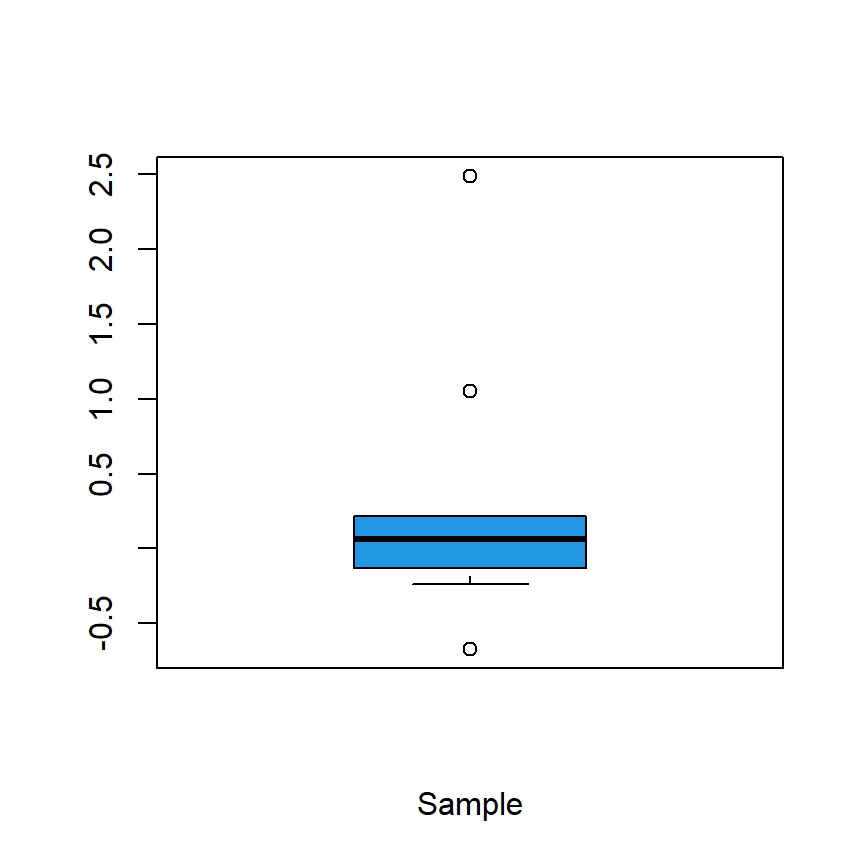
You can perform a Wilcoxon signed rank test to check if the median of x is equal to 0:
# Sample data
x <- c(0.22, 1.05, -0.24, 0.18, 0.16, -0.67, 2.49, -0.07, -0.13, -0.03)

# Is the median of 'x' equal to 0?
wilcox.test(x, mu = 0)
Wilcoxon signed rank exact test
data: x
V = 34, p-value = 0.5566
alternative hypothesis: true location is not equal to 0The previous test returns a p-value of 0.5566, greater than the usual significance levels, so there is no evidence to reject the null hypothesis that the median of x equals 0.
Median greater than a specific value
The previous test was a two sided test, but you can also perform one sided tests with alternative. When alternative = "greater" the null and alternative hypotheses are the following:
- \(H_0\): the median of X is LOWER THAN OR EQUAL to \(\mu\).
- \(H_1\): the median of X is GREATER than \(\mu\).
The following example illustrates how to test if the median of x is greater than -1:
# Sample data
x <- c(0.22, 1.05, -0.24, 0.18, 0.16, -0.67, 2.49, -0.07, -0.13, -0.03)

# Is the median of 'x' greater than -1?
wilcox.test(x, mu = -1, alternative = "greater")
Wilcoxon signed rank exact test
data: x
V = 55, p-value = 0.0009766
alternative hypothesis: true location is greater than -1The p-value is close to zero, implying there is statistical evidence against the null hypothesis that the median of X is lower or equal than -1.
Median less than a specific value
The last option is to set alternative = "less". In this scenario the null and alternative hypotheses are:
- \(H_0\): the median of X is GREATER THAN OR EQUAL to \(\mu\).
- \(H_1\): the median of X is LOWER than \(\mu\).
The following code performs a Wilcoxon test to check if the median of x is less than 0:
# Sample data
x <- c(0.22, 1.05, -0.24, 0.18, 0.16, -0.67, 2.49, -0.07, -0.13, -0.03)

# Is the median of 'x' lower than 0?
wilcox.test(x, mu = 0, alternative = "less")
Wilcoxon signed rank exact test
data: x
V = 34, p-value = 0.7539
alternative hypothesis: true location is less than 0The function returns a p-value of 0.7539, greater than the usual significance levels. Therefore, there is no evidence to reject the null hypothesis that the median of x is greater than or equal to 0.
Paired samples
The Wilcoxon signed rank test can also be computed for two related groups or paired observations (X and Y) to determine if their medians are significantly different. To perform this test you will need to input two vectors of data and set paired = TRUE. The hypotheses are the following:
- \(H_0\): the median of X IS EQUAL to the median of Y (the difference of medians is 0).
- \(H_1\): the median of X IS DIFFERENT than the median of Y (the difference of medians is not 0).
# Sample data
x <- c(0.22, 1.05, -0.24, 0.18, 0.16, -0.67, 2.49, -0.07, -0.13, -0.03)
y <- c(0.98, -1.25, 0.03, 0.25, -0.72, 1.33, 0.81, 0.09, -0.04, -1.31)

# Is the median of 'x' equal to the median of 'y'? (Paired samples)
wilcox.test(x, y, mu = 0, paired = TRUE)
Wilcoxon signed rank exact test
data: x and y
V = 31, p-value = 0.7695
alternative hypothesis: true location shift is not equal to 0The test returns a p-value of 0.7695, implying there is no statistical evidence to reject the null hypothesis that the medians are equal (the difference of medians is zero).
Wilcoxon rank sum test (Mann-Whitney U test) for two samples
The Wilcoxon Rank-Sum test, also known as the Mann-Whitney U test, is employed to compare the distributions of two independent samples. It’s used when the assumptions of the t-test (such as normality and equal variances) are not met.
Equal medians (equal distributions)
The null and alternative hypotheses in this scenario are the following:
- \(H_0\): the median of X IS EQUAL to the median of Y.
- \(H_1\): the median of X IS DIFFERENT to the median of Y.
Note that the previous hypotheses can be reformulated using a location shift of \(\mu\) (usually \(\mu = 0\), implying equal medians):
- \(H_0\): the location shift between X and Y IS \(\mu\).
- \(H_1\): the location shift between X and Y IS NOT \(\mu\).
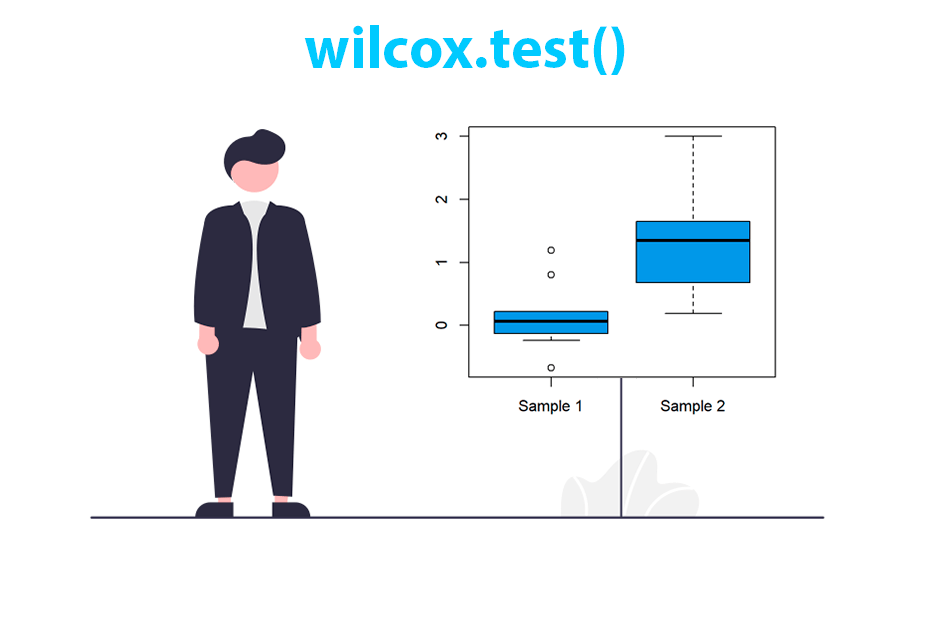
For the following examples we are going to use two independent samples named x and y represented in the box plot below.
# Sample data
x <- c(0.22, 0.8, -0.24, 0.18, 0.16, -0.67, 1.19, -0.07, -0.13, -0.03)
y <- c(0.19, 3.00, 1.34, 1.35, 1.95, 1.63, 0.68, 0.51, 1.65, 0.92)

# Box plot
boxplot(x, y, col = 4, names = c("Sample 1","Sample 2"))![]()
To test whether the two samples have the same distribution (equal medians) you can input both vectors into the wilcox.test function, as demonstrated below.
# Sample data
x <- c(0.22, 0.8, -0.24, 0.18, 0.16, -0.67, 1.19, -0.07, -0.13, -0.03)
y <- c(0.19, 3.00, 1.34, 1.35, 1.95, 1.63, 0.68, 0.51, 1.65, 0.92)

# Is the median of 'x' equal to the median of 'y'?
wilcox.test(x, y)
Wilcoxon rank sum exact test
data: x and y
W = 8, p-value = 0.0007253
alternative hypothesis: true location shift is not equal to 0The p-value is lower than the usual significance levels, so there is evidence against the null hypothesis that the median of x is equal to the median of y. This suggests that the medians of the two samples are likely not equal, indicating a shift in the central tendencies between the groups.
Median of X greater than the median of Y
For the one sided case, when alternative = "greater" the hypotheses are the following:
- \(H_0\): the median of X LOWER THAN OR EQUAL to the median of Y.
- \(H_1\): the median of X IS GREATER than the median of Y.
The block of code below demonstrates how to perform a Wilcoxon rank sum to test if the median of x is greater than the median of y.
# Sample data
x <- c(0.22, 0.8, -0.24, 0.18, 0.16, -0.67, 1.19, -0.07, -0.13, -0.03)
y <- c(0.19, 3.00, 1.34, 1.35, 1.95, 1.63, 0.68, 0.51, 1.65, 0.92)

# Is the median of 'x' greater than median of 'y'?
wilcox.test(x, y, alternative = "greater")
Wilcoxon rank sum exact test
data: x and y
W = 8, p-value = 0.9998
alternative hypothesis: true location shift is greater than 0Median of X less than the median of Y
The last options is to set alternative = "less", which has the following hypotheses:
- \(H_0\): the median of X GREATER THAN OR EQUAL to the median of Y.
- \(H_1\): the median of X IS LESS than the median of Y.
Type the following to test if the median of x is lower than the median of y (the difference is less than 0):
# Sample data
x <- c(0.22, 0.8, -0.24, 0.18, 0.16, -0.67, 1.19, -0.07, -0.13, -0.03)
y <- c(0.19, 3.00, 1.34, 1.35, 1.95, 1.63, 0.68, 0.51, 1.65, 0.92)

# Is the median of 'x' lower than the median of 'y'?
wilcox.test(x, y, alternative = "less")
Wilcoxon rank sum exact test
data: x and y
W = 8, p-value = 0.0003626
alternative hypothesis: true location shift is less than 0The p-value is close to zero, implying there is evidence to reject the null hypothesis that the median of x is greater than or equal to the median of y. Therefore, we have sufficient statistical evidence to favor the alternative hypothesis, indicating a probable difference in the locations (medians) of the two samples, with x likely having a lower median than y.