Random samples and permutations in R
The sample function in R is used to create random samples or permutations (samples with or without replacement) and even select elements randomly based on specific probabilities assigned to each element (weighted sampling).
If you run the examples of this tutorial you will get other output. Set a seed with set.seed to make the results reproducible.
Syntax of sample
The sample function has the following syntax:
sample(x, size, replace = FALSE, prob = NULL)Being:
x: a vector or list containing the elements from which to select a sample.size: the number of items to select. Ifreplace = TRUE, it specifies the number of items to sample with replacement.replace: a logical value indicating whether sampling should be done with replacement (TRUE) or without replacement (FALSE). Default isFALSE.prob: an optional vector of probability weights for obtaining the elements ofx.
Random sample without replacement
By default, the sample function returns a random permutation of the input vector, this is, it returns the elements of the vector but in a different order (without repeating any). The following example illustrates how the function returns the vector named x but in one of the possible different orders.
x <- 1:10

# Permutation of 'x'
sample(x)
2 3 10 7 5 9 4 6 1 8Note that you can also utilize the sample function with character or boolean vectors and even lists.
y <- c("A", "A", "C", "D")

# Permutation of 'y'
sample(y)
"D" "C" "A" "A"With size you can control the length of the output. The example below illustrates how to return only one sample, this is, 1 out of the 10 elements of the input vector.
x <- 1:10

# One sample
sample(x, size = 1)3Notice that you can’t input a value greater than the length of the input vector. In this scenario an error will arise unless you set replace = TRUE.
x <- 1:10

# 'size' can't be greater than the length of 'x'
sample(x, size = 15)
Error in sample.int(length(x), size, replace, prob) :
cannot take a sample larger than the population when 'replace = FALSE'Random sample with replacement
When replace = TRUE the sampling is performed with replacement, so if an element is choose it can also be chosen in the following sample and the same element can appear several times.
x <- 1:10

# Random sample with replacement
sample(x, replace = TRUE)
5 2 4 6 7 6 3 7 10 1In this scenario, the sample size can be greater than the length of the input vector and the elements can be repeated.
x <- 1:10

# Random sample
sample(x, size = 15, replace = TRUE)
2 7 4 3 1 7 2 4 4 3 10 7 2 5 3Weighted sampling
When a random sample is computed all the elements have the same probability. This can be illustrated with a bar plot with the proportions of a random sample of a vector with two different elements.
set.seed(21)
tab <- table(sample(c("A", "B"), size = 10000, replace = TRUE))

# Bar plot with the proportions
barplot(prop.table(tab), col = c(4, 3), main = "Random sampling")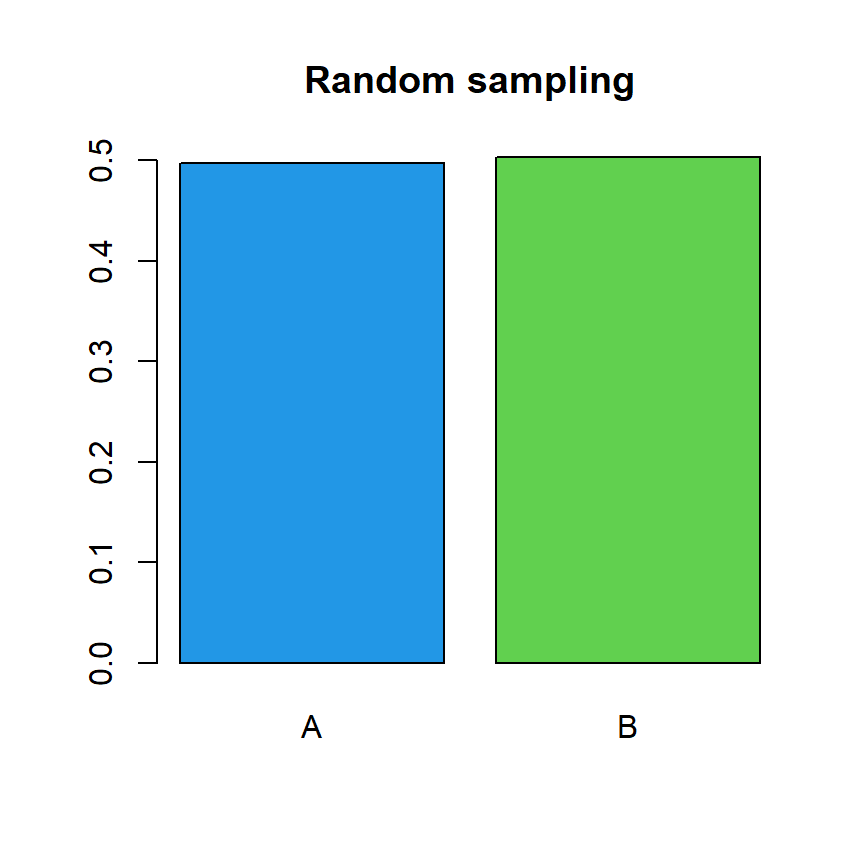
However, the prob argument allows specifying different probabilities for each element to reflect real-world scenarios. In the following example the first element of the vector will have a probability of 0.8 while the second 0.2.
# Weighted sampling
sample(c("A", "B"), size = 10, prob = c(0.8, 0.2), replace = TRUE)
"A" "B" "B" "A" "A" "A" "A" "A" "A" "A"The proportions of the elements of the output will be (as in this example) or will be close to the specified probabilities.
tab <- table(c("A", "B", "B", "A", "A", "A", "A", "A", "A", "A"))

# Bar plot with the proportions
barplot(prop.table(tab), col = c(4, 3), main = "Weighted sampling")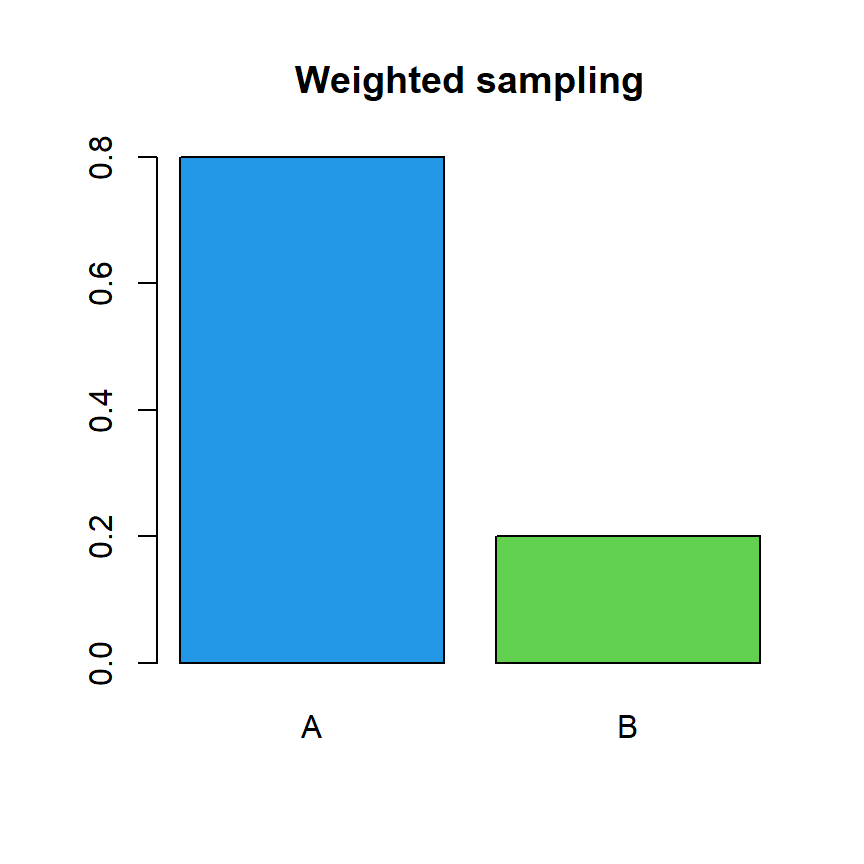
Notice that the proportions of elements of the output will converge to the specified probabilities as the sample size increases. The following block of code creates a line chart to illustrate this convergence.
# Sample sizes
s <- seq(5, 10000, 5)

# Empty data frame
df <- data.frame("A" = NA, "B" = NA)

# Calculate samples for different sample sizes
set.seed(2)
for(i in 1:length(s)) {

  a <- sample(c("A", "B"), size = i, replace = TRUE, prob = c(0.2, 0.8))

  df[i, ] <- prop.table(table(a))

}

# Line chart
plot(s, df$A, type = "l", xlab = "Sample size", ylab = "%")
lines(s, df$B, type = "l", col = 4)
abline(h = 0.8, lty = 2, col = "red")
abline(h = 0.2, lty = 2, col = "red")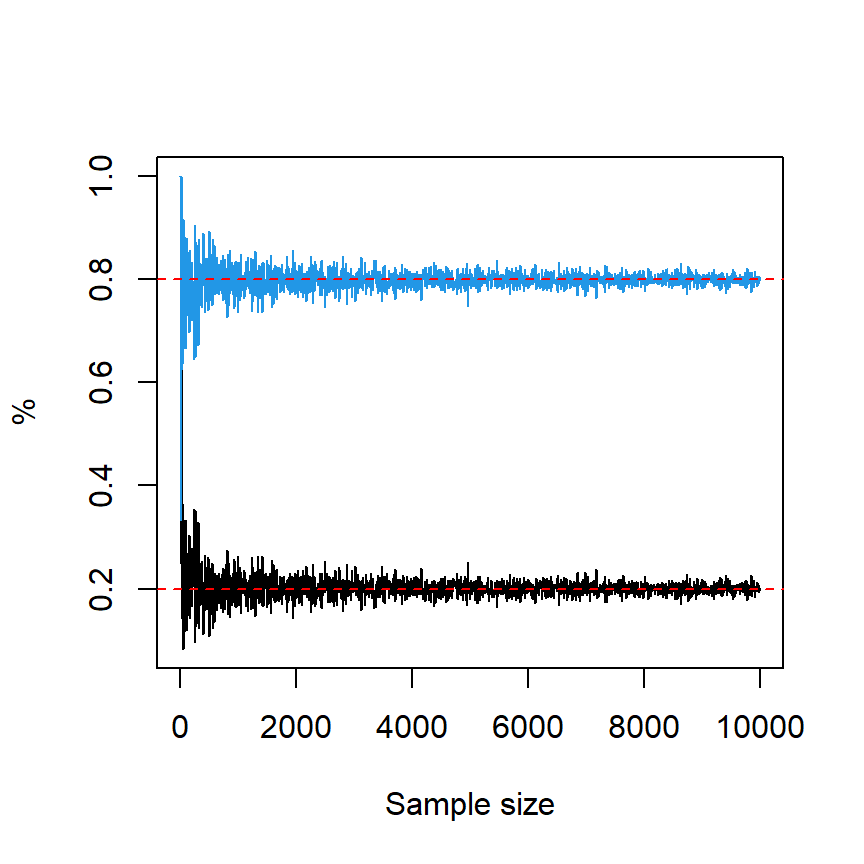
Additional examples
Reproducible samples
As stated before, if you don’t set a seed your results won’t be reproducible. The set.seed function allows to specify a seed for pseudo-random number generation and hence make the output reproducible.
# Set a seed (any integer)
set.seed(1)

# Reproducible sample
sample(1:10)
9 4 7 1 2 5 3 10 6 8If you run the previous code you will get the same output of the block of code.
Sample of the rows of a data frame
A common use case of the sample function is to randomly select rows of a data frame. As rows in R can be selected using indices, you can create a sample of the desired size of a vector from 1 to the number of rows to create a sample of rows.
# Sample data
set.seed(21)
df <- data.frame(x = 1:10, y = rnorm(10))

# Select 5 rows randomly
df[sample(1:nrow(df), size = 5), ]
x y
10 10 -0.002393336
1 1 0.793013171
2 2 0.522251264
7 7 -1.570199630
8 8 -0.934905667