Interquartile range in R

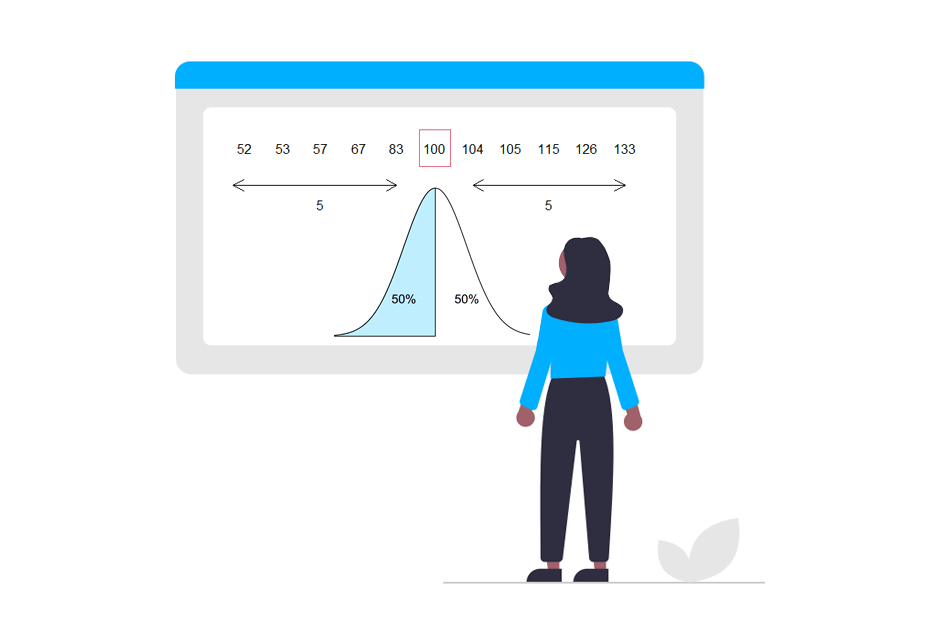
The interquartile range is a measure of statistical dispersion, specifically the difference between the third quartile (\(Q_3\)) and the first quartile (\(Q_1\)):
\[IQR = Q_3 - Q_1\]
This measured can be computed in R with the IQR function.
Check the quantiles tutorial to learn more about how quartiles are calculated in R.
Syntax
The interquartile range can be computed in R with the IQR function, which has the following syntax:
IQR(x,             # Numeric vector
    na.rm = FALSE, # If TRUE, missing values are removed
    type = 7)      # Integer between 1 and 9 selecting a quantile algorithm
In the following section we are going to illustrate the usage of this function with some examples.
Examples
Interquartile range of a vector
Given a sample vector x you can input it to the IQR function to calculate its interquartile range:
# Sample data
x <- c(19, 21, 16, 1, 4, 2, 17, 24)

# Interquartile range of 'x'
IQR(x)16The function return 16. Let’s compute it manually using the quantile function for a better understanding:
# Sample data
x <- c(19, 21, 16, 1, 4, 2, 17, 24)

# Quartiles of 'x'
Q <- quantile(x)
Q
0% 25% 50% 75% 100%
1.0 3.5 16.5 19.5 24.0 The interquartile range is calculated as the third quartile (19.5) minus the first quartile (3.5), this is:
# Interquartile range of 'x'
Q[4] - Q[2]

# Equivalent to:
# quantile(x, probs = 0.75) - quantile(x, probs = 0.25)
75%
16 Note that you can also specify other algorithm to compute quantiles making use of type, which takes an integer from 1 to 9 as input. The example below computes the interquartile range of x with the type 8 algorithm.
# Sample data
x <- c(19, 21, 16, 1, 4, 2, 17, 24)

# Interquartile range of 'x' with Type 8 algorithm
IQR(x, type = 8)17.33333Interquartile range with missing values
If your data contains missing values you can set na.rm = TRUE in order to remove them from the computation.
# Sample data
x <- c(19, 21, NA, 1, 4, 2, NA, 24)

# Interquartile range of 'x' with missing values
IQR(x, na.rm = TRUE)18Interquartile range of the columns of a data frame
It is possible to calculate the interquartile range of the columns of a data frame using the apply function by columns as follows:
# Sample data
df <- data.frame(x = rnorm(10), y = rexp(10), z = runif(10))

# Interquartile range of the columns of a data frame
apply(df, 2, IQR)
x y z
2.6869600 0.6245126 0.3334760 Semi interquartile range
The semi interquartile range (SIQR) is the interquartile range divided by two. This is:
\[SIQR = \frac{(Q_3 - Q_1)}{2}\]
See the example below for further clarification:
# Sample data
x <- c(19, 21, 16, 1, 4, 2, 17, 24)

# Semi interquartile range of 'x'
SIQR <- IQR(x) / 2
SIQR8The fmsb package provides a function named SIQR to compute the semi interquartile range using fivenum (by default) or IQR.