R TUTORIALS
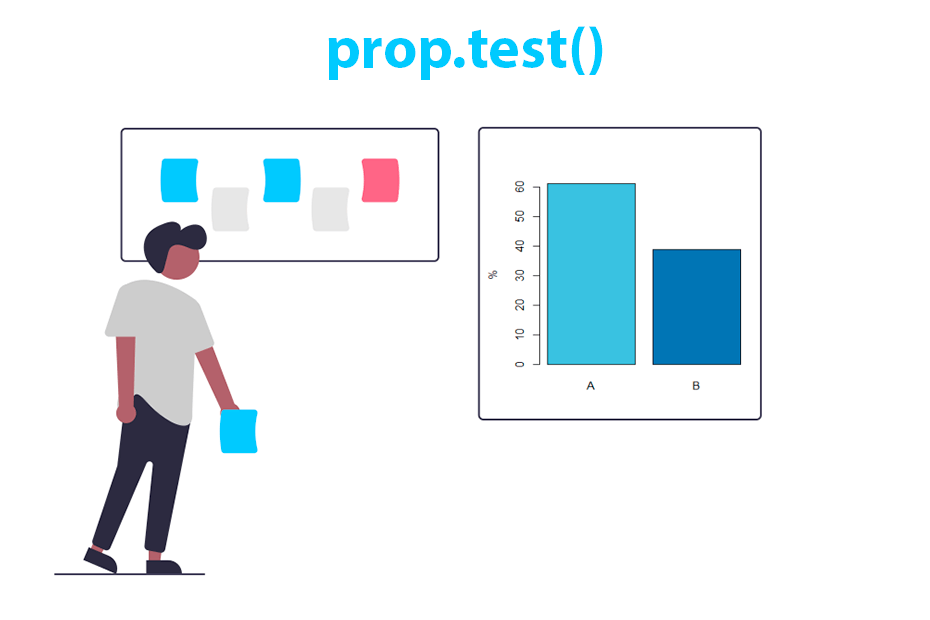
Test for proportions with prop.test()
Statistics with R Hypothesis testing
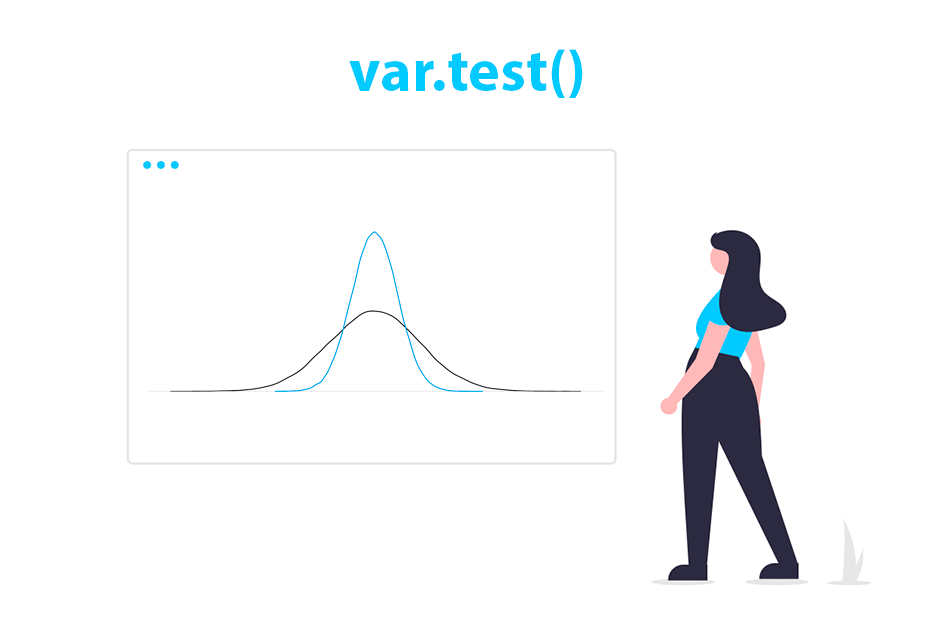
F test with var.test() to compare two variances
Statistics with R Hypothesis testing
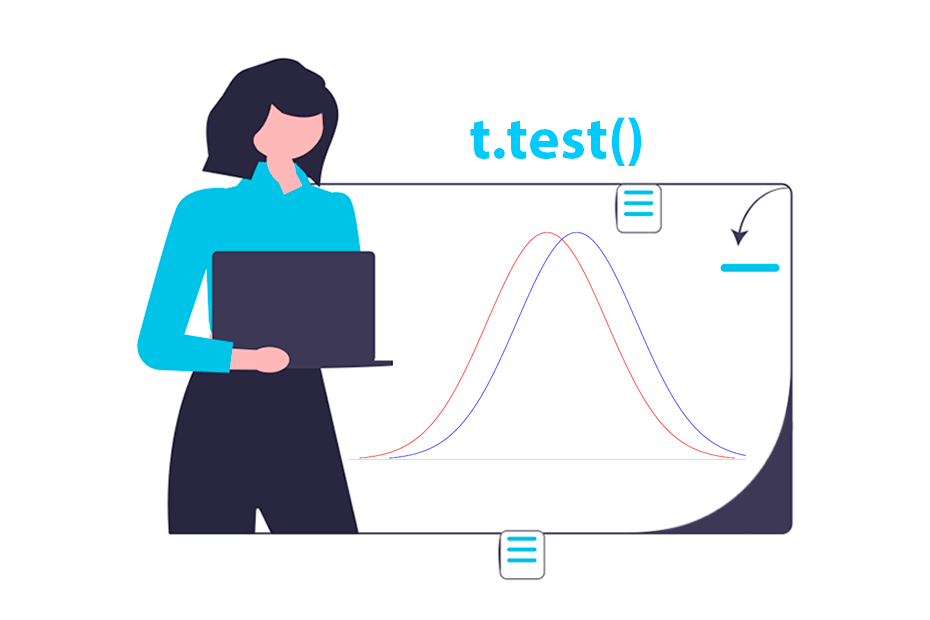
T-test to compare means
Statistics with R Hypothesis testing
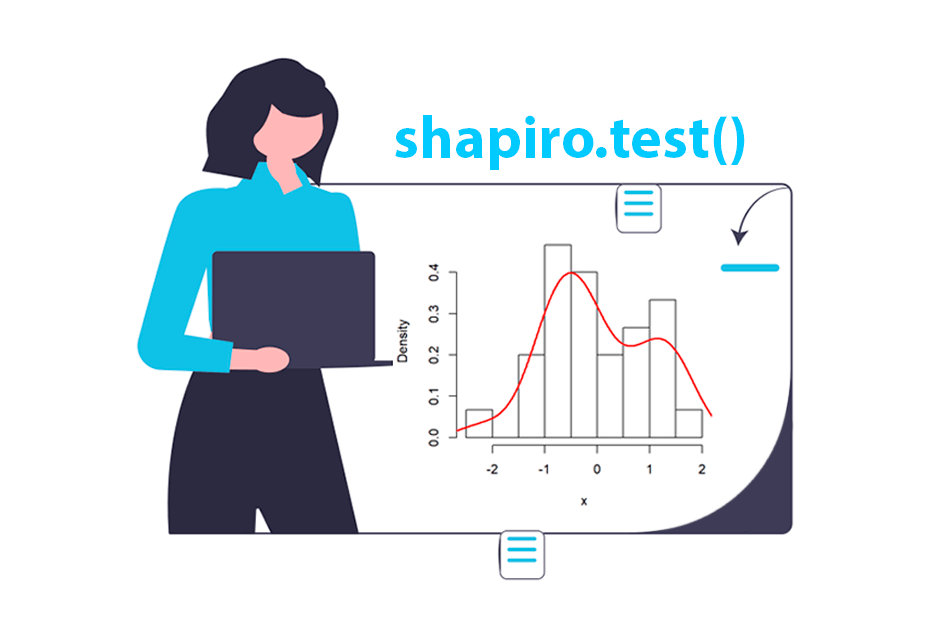
Shapiro Wilk normality test
Statistics with R Hypothesis testing

The switch function
R introduction Control Structures
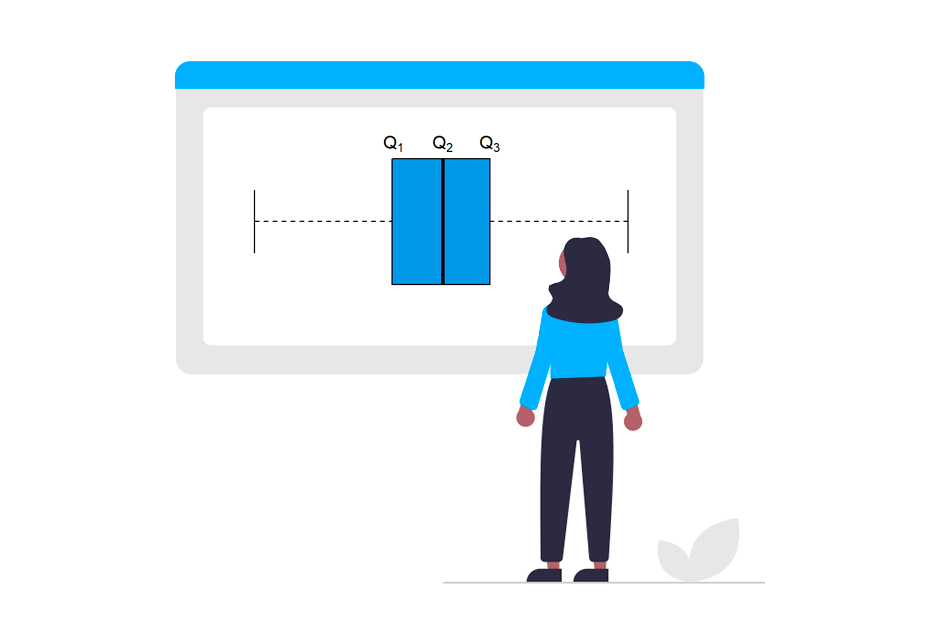
Quantiles
Statistics with R Location measures
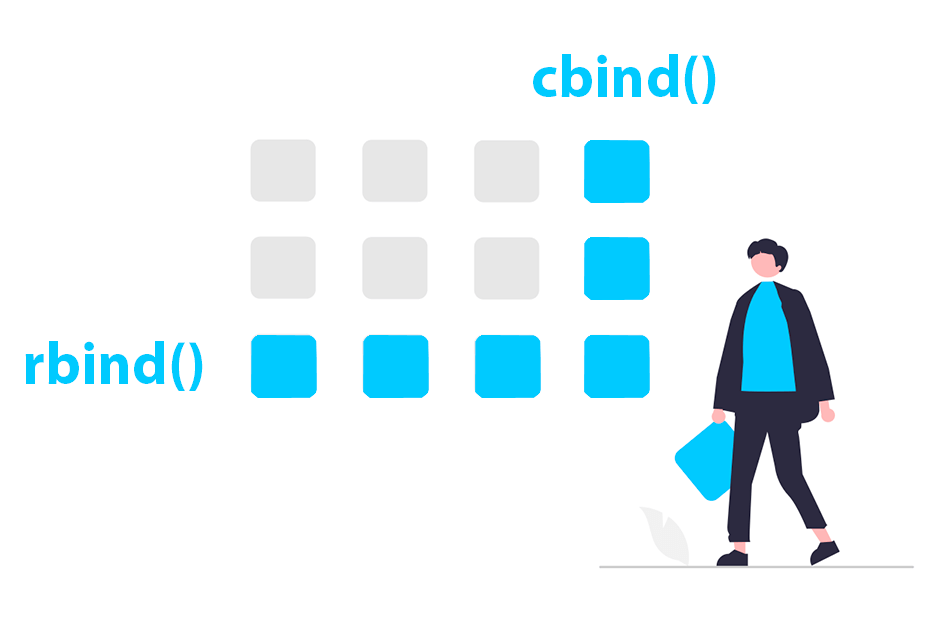
rbind() and cbind() functions
Data Manipulation in R Data transformation
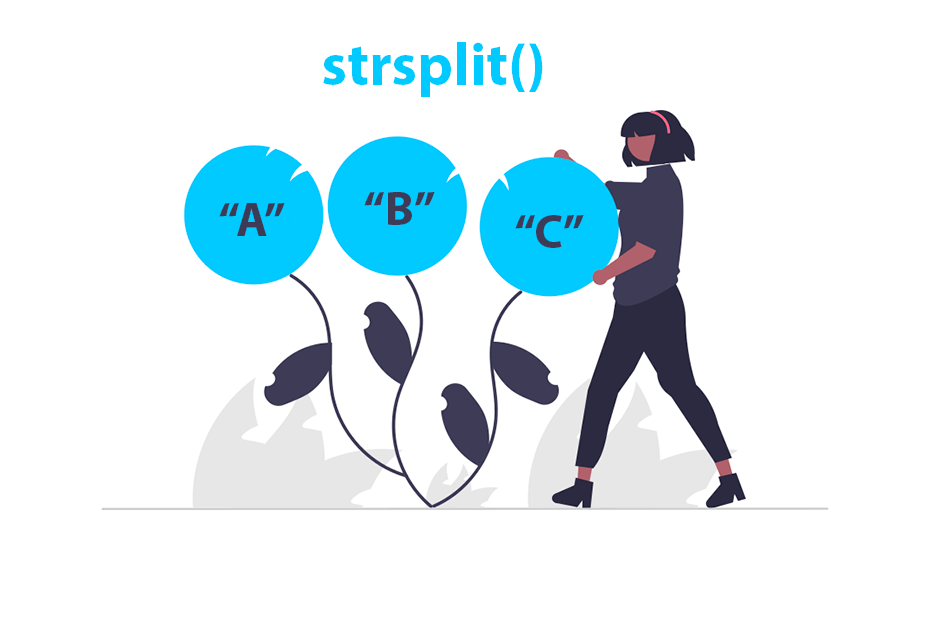
Split strings with strsplit()
Data Manipulation in R String manipulation

Web scraping with rvest
Data Manipulation in R Import and export data
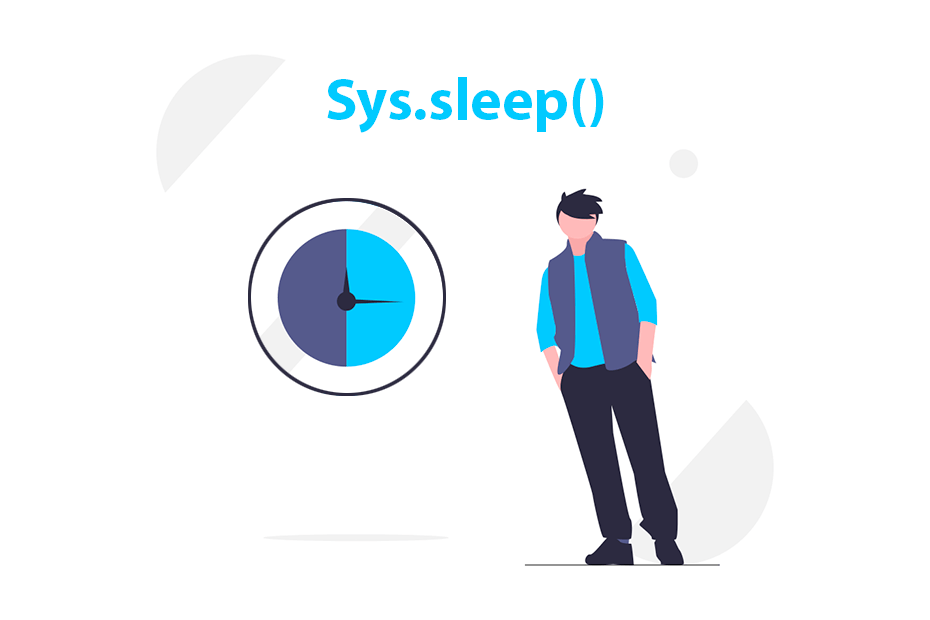
Suspend the execution of an R code for a time interval
R introduction Flow control
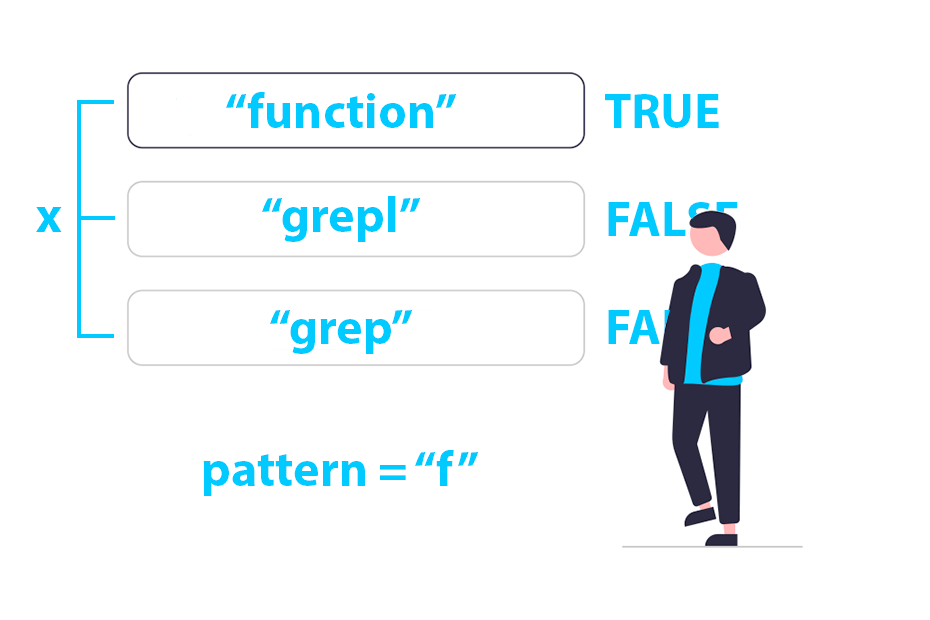
Pattern matching with grepl() and grep()
Data Manipulation in R String manipulation
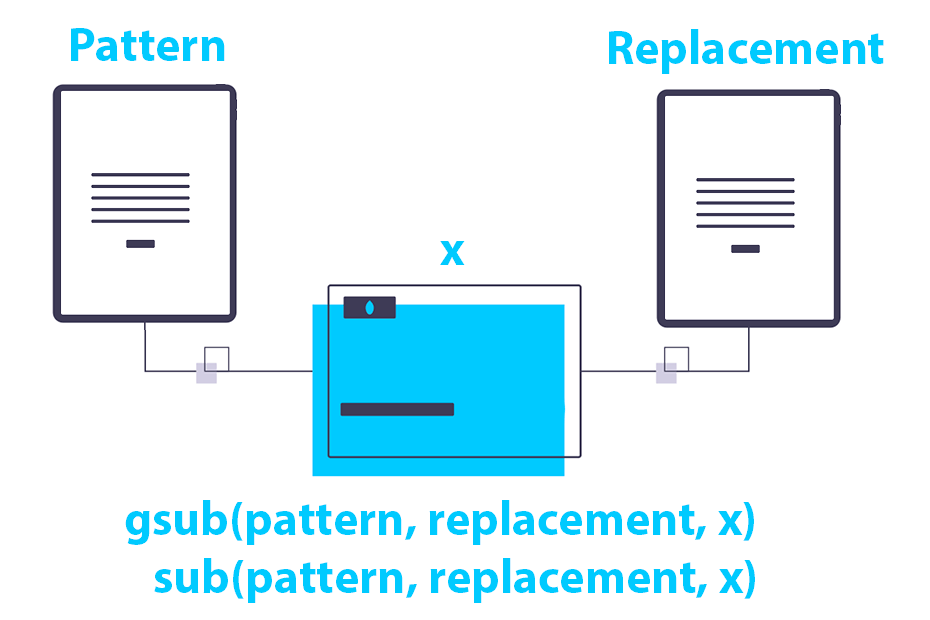
Pattern matching and replacement with gsub() and sub()
Data Manipulation in R String manipulation
R LANGUAGE TUTORIALS
On this page you will find all the tutorials available on this website. The R programming tutorials are divided into categories you can find above the articles, and some categories are also divided into tags. Currently, the categories within this R blog are:
-
Introduction to R
The introductory tutorials are composed by R programming language tutorials for beginners. This include tutorials about getting help with help functions, package manuals or online resources, setting the working directory and managing the workspace, the different R operators and their characteristics, tutorials of each R data structure to store objects or control structures to control the flow of the code and even installing new R packages in base R or RStudio, among other related concepts. -
Data manipulation
On the one hand, the data manipulation tutorials include reading data from files like CSV or TXT, or even from the web and saving data to data files in order to store the results of your analyses. On the other, these tutorials include data wrangling tutorials, that is the process of transforming raw data into a format you can use for your analysis, like subsetting, slicing, categorizing or transforming the data in any possible way. -
Graphics
R is a powerful tool for creating graphs. There are several ways for creating this plots: using basic R functions or with specific R graphics packages, like ggplot2 or lattice libraries. In this set of tutorials you will find how to use theplotfunction of base R, how to create boxplots, barplots, histograms, density plots, dot plots, violin plots and all types of statistical representations. -
Statistics
R offers a robust statistical environment with multitude of specialized packages providing a comprehensive suite of tools for performing intricate analyses, data visualization, hypothesis testing, regression modeling, and exploratory data analysis, facilitating in-depth statistical exploration and interpretation of data.