PROBABILITY DISTRIBUTIONS IN R
A statistical distribution, also known as a probability distribution, is a mathematical function that describes the likelihood of different outcomes or values occurring in a dataset or a random phenomenon
CONTINUOUS DISTRIBUTIONS
Continuous distributions describe the probability distribution of a continuous random variable. This type of random variable can take on any value within a specified range or interval, and the probability of obtaining any specific value is zero
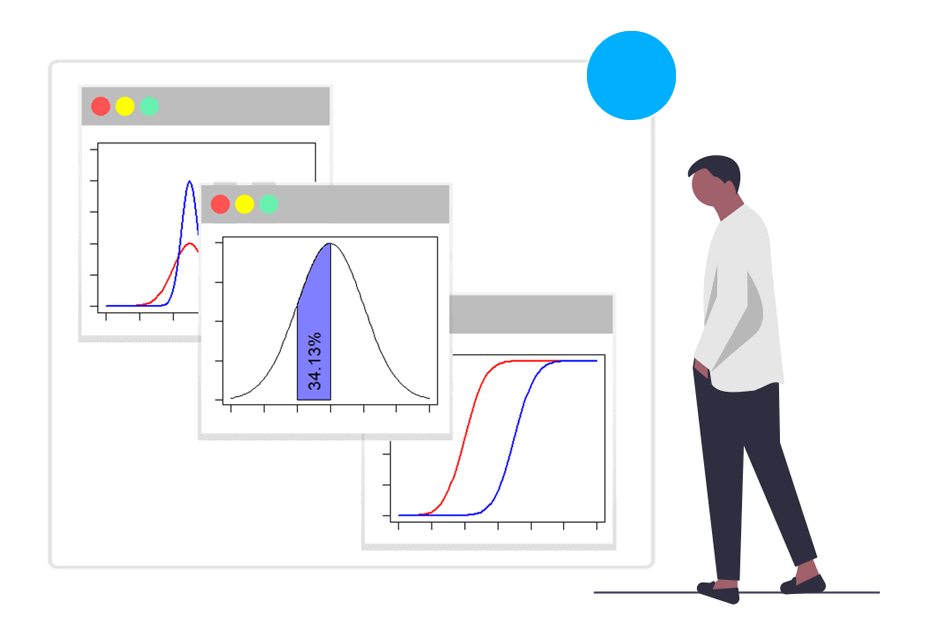
Normal distribution
dnorm() pnorm() qnorm() rnorm()
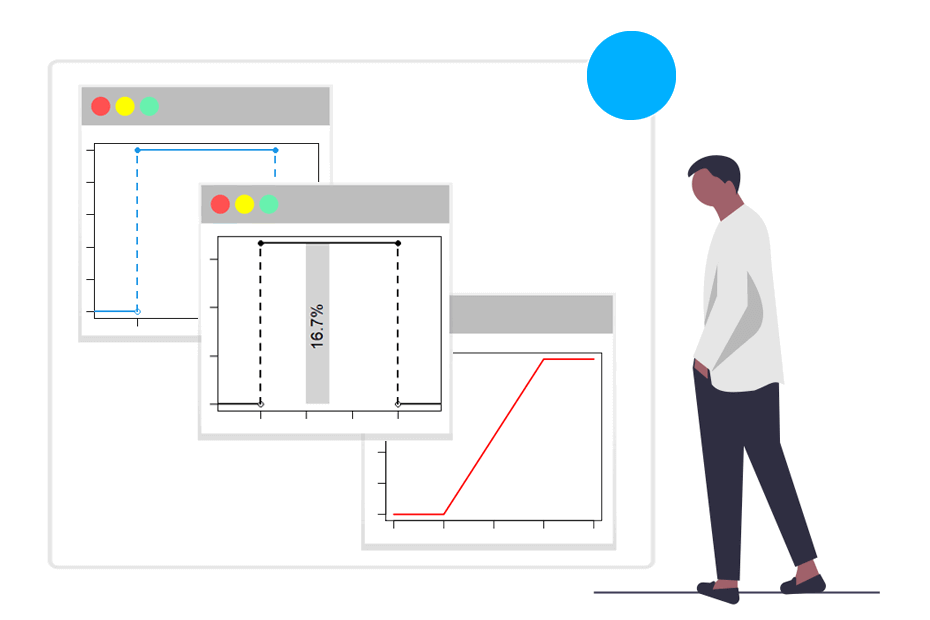
Continuous uniform distribution
dunif() punif() qunif() runif()
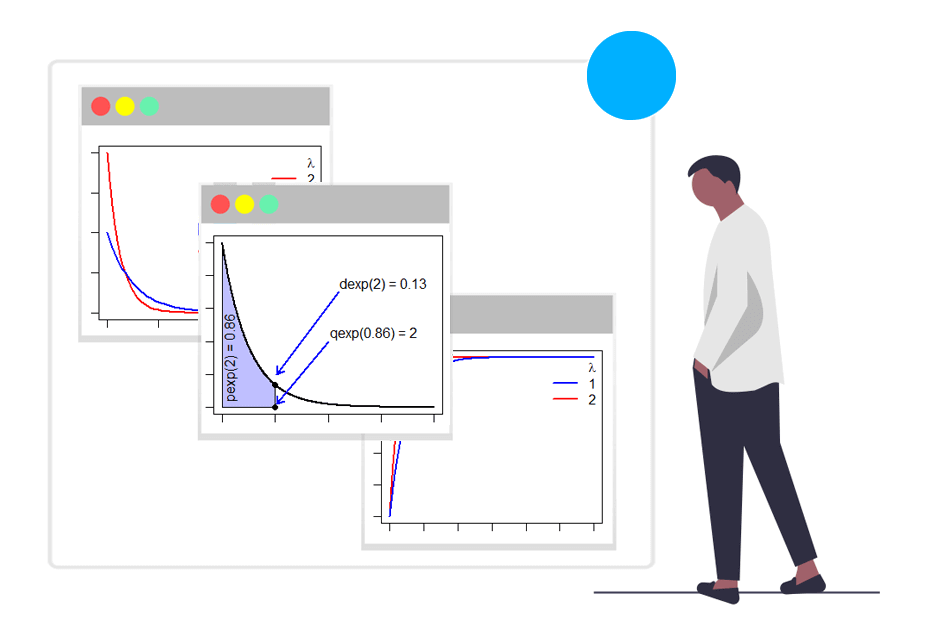
Exponential distribution
dexp() pexp() qexp() rexp()
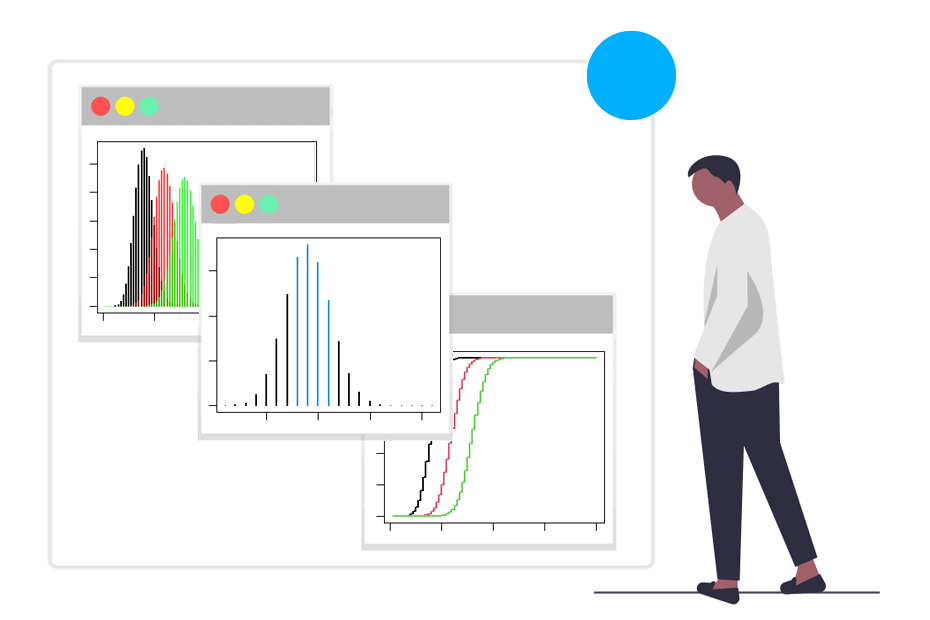
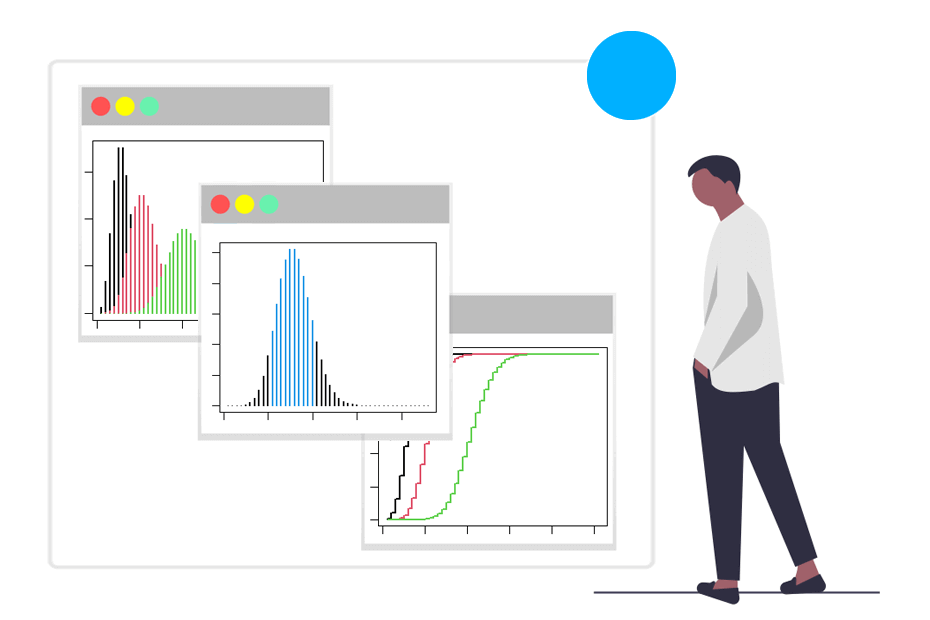
DISCRETE DISTRIBUTIONS
Discrete distributions describe the probability distribution of a discrete random variable. This type of random variable can take on only distinct, separate values, typically integers, and the probability associated with each value is defined individually