Create statistical summaries in R with the summarise() function from dplyr
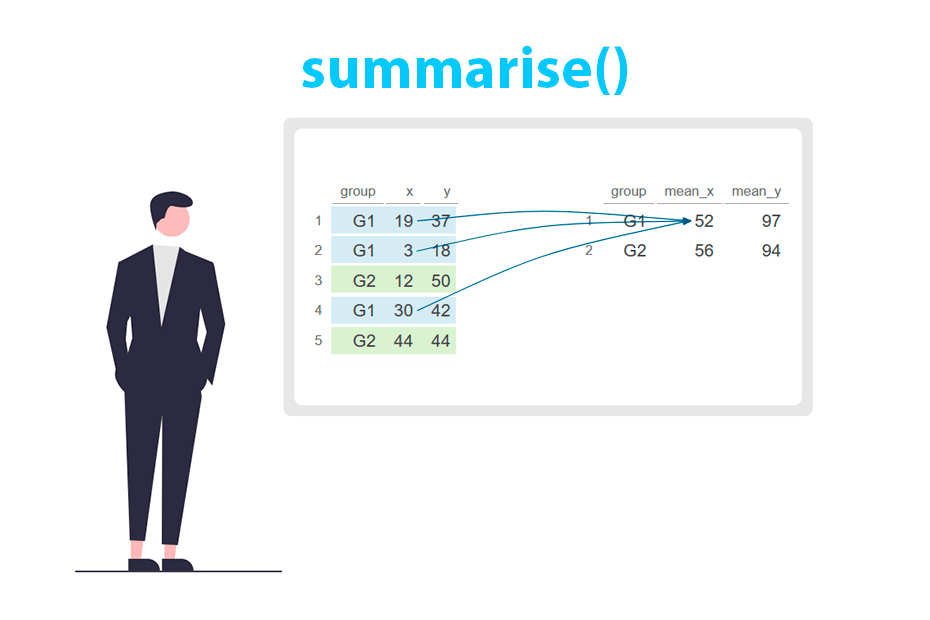
The summarise (or summarize) function is used for aggregating and summarizing data. It’s particularly helpful for condensing data into a single row per group, offering various statistical summaries or computations for each group. This function creates a new data frame with the specified summary statistics.
Syntax
The summarise or summarize function takes a dataset as input and creates a new one with columns calculated by applying a function to one or multiple columns from the original data. The syntax is as follows:
summarise(data, new_column = function(column))summarise and summarize are both the same function.
Statistical summaries of the data
Given a dataset, you can generate a new data frame containing statistical summaries of specific variables from the original data frame. The table below describes some of the most useful functions for use with summarise, such as mean or sum.
| Function | Description |
|---|---|
| mean() | Mean of the values |
| median() | Median of the values |
| sd(), var() | Standard deviation and variance of the values |
| quantile() | Quantiles of the values |
| IQR() | Interquartile range |
| min(), max() | Minimum and maximum value |
| first() | First value |
| last() | Last value |
| nth() | Nth value |
| n() | Number of elements per group |
| n_distinct() | Number of unique values |
In the example below we demonstrate how to generate a new data frame containing the average of the numerical variables from the original data frame.
library(dplyr)

set.seed(9)
df <- data.frame(group = sample(c("G1", "G2"), 5, replace = TRUE),
                 x = sample(1:50, 5), y = sample(1:50, 5))

# Mean of 'x' and mean of 'y'
df_2 <- df %>%
  summarise(mean_x = mean(x), mean_y = mean(y))

df_2
mean_x mean_y
1 21.6 38.2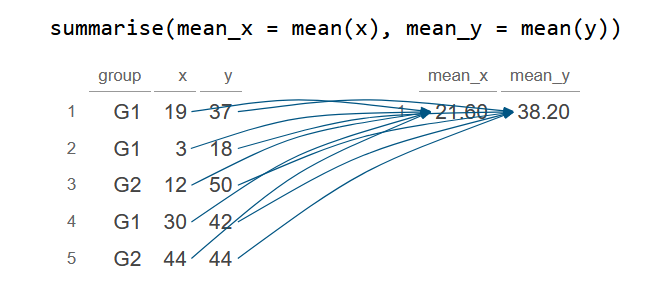
Note that the resulting output will contain as many rows as the values returned by the input function.
library(dplyr)

set.seed(9)
df <- data.frame(group = sample(c("G1", "G2"), 5, replace = TRUE),
                 x = sample(1:50, 5), y = sample(1:50, 5))

# Quartiles of 'x' and quartiles of 'y'
df_2 <- df %>%
  summarise(quartiles_x = quantile(x), quartiles_y = quantile(y))

df_2
quartiles_x quartiles_y
1 3 18
2 12 37
3 19 42
4 30 44
5 44 50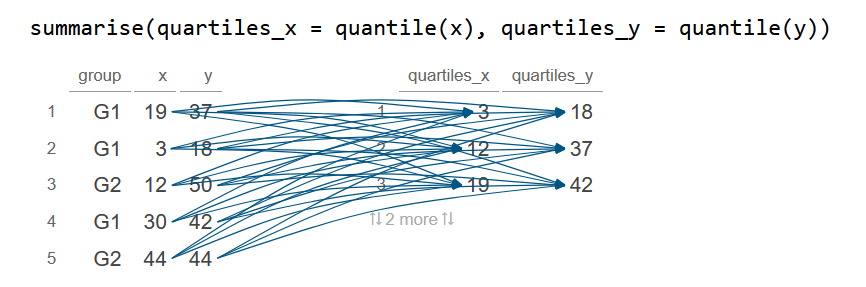
Summarise data by group with group_by
The summarise function is particularly useful in conjunction with group_by. In this scenario, the new data frame will contain statistical summaries for each group.
The example below calculates the mean for each column based on the groups of the group variable.
library(dplyr)

set.seed(9)
df <- data.frame(group = sample(c("G1", "G2"), 5, replace = TRUE),
                 x = sample(1:50, 5), y = sample(1:50, 5))

# Sum of 'x' and sum of 'B' by group
df_2 <- df %>%
  group_by(group) %>%
  summarise(mean_x = sum(x), mean_y = sum(y))

df_2
# A tibble: 2 × 3
group mean_x mean_y
<chr> <int> <int>
1 G1 52 97
2 G2 56 94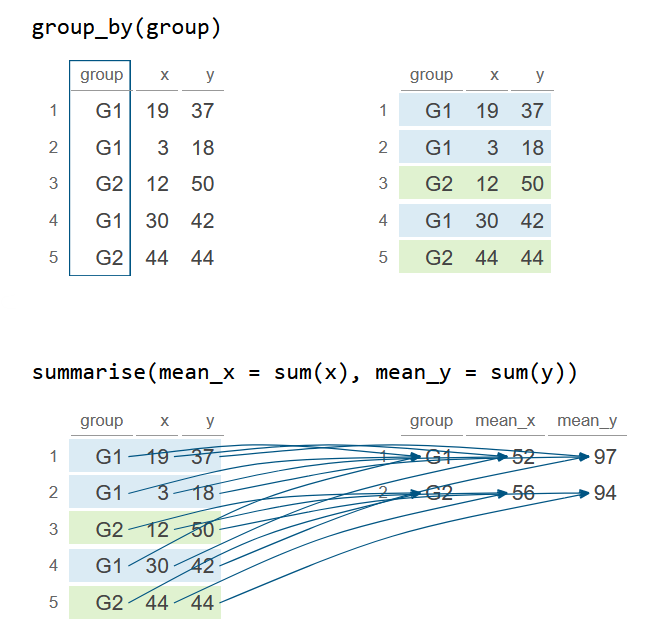
Additionally, you can group by more than one categorical variable. In this scenario, the function calculates statistical summaries for each group and subgroup. By default, the output is grouped by the first categorical variable, as indicated by a message.
library(dplyr)

set.seed(9)
df <- data.frame(group = sample(c("G1", "G2"), 5, replace = TRUE),
                 group_2 = sample(c("G3", "G4"), 5, replace = TRUE),
                 x = sample(1:50, 5), y = sample(1:50, 5))

# Sum of 'x' and sum of 'y' by group
df_2 <- df %>%
  group_by(group, group_2) %>%
  summarise(sum_x = sum(x), sum_y = sum(y))

df_2
`summarise()` has grouped output by 'group'. You can override using the `.groups` argument.
# A tibble: 4 × 4
# Groups: group [2]
group group_2 mean_x mean_y
<chr> <chr> <int> <int>
1 G1 G3 74 86
2 G1 G4 18 30
3 G2 G3 48 22
4 G2 G4 37 35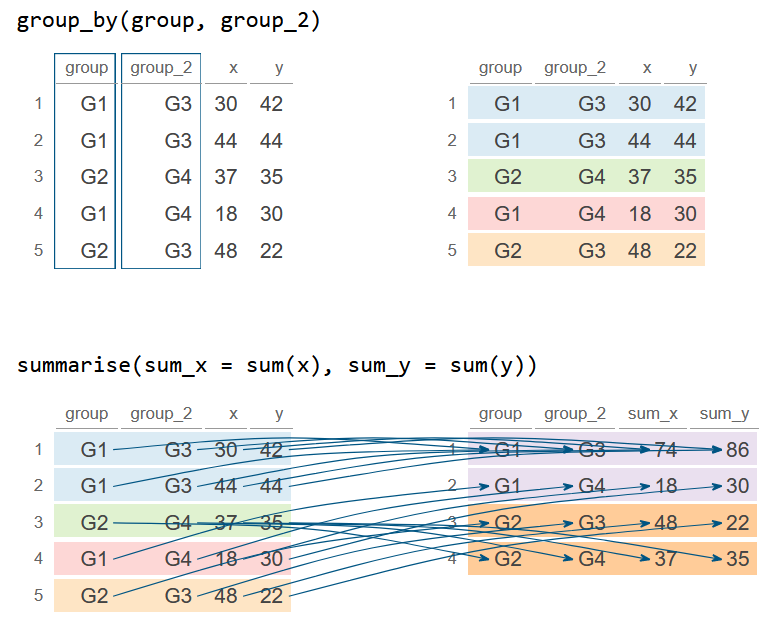
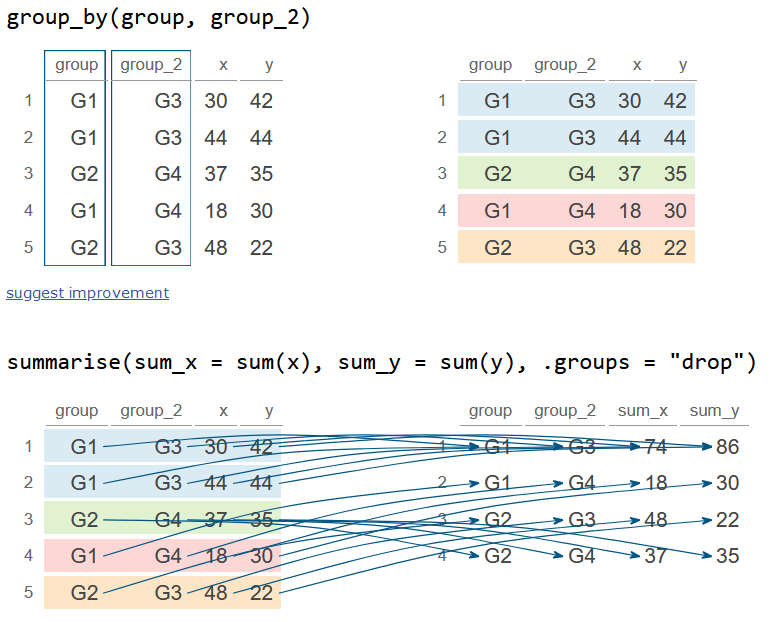
The .groups argument is optional and can take one of the following values: "drop_last" to drop the last level of grouping, "drop" to drop all groups, "keep" to preserve the original grouping or "rowwise", to treat each row as its own group.
library(dplyr)

set.seed(9)
df <- data.frame(group = sample(c("G1", "G2"), 5, replace = TRUE),
                 group_2 = sample(c("G3", "G4"), 5, replace = TRUE),
                 x = sample(1:50, 5), y = sample(1:50, 5))

# Sum of 'x' and sum of 'y' by group
df_2 <- df %>%
  group_by(group, group_2) %>%
  summarise(sum_x = sum(x), sum_y = sum(y), .groups = "drop")

df_2
# A tibble: 4 × 4
group group_2 sum_x sum_y
<chr> <chr> <int> <int>
1 G1 G3 74 86
2 G1 G4 18 30
3 G2 G3 48 22
4 G2 G4 37 35Notice the difference from the previous output:
Summarise multiple columns
Instead of manually specifying several columns, you can create summaries by selecting them based on a condition using summarise in combination with across. See the list of helper functions to select columns.
In the following example, the variance of all columns except group is calculated, and the resulting columns are renamed using the original column names with the "_var" suffix.
library(dplyr)

set.seed(9)
df <- data.frame(group = sample(c("G1", "G2"), 5, replace = TRUE),
                 x = sample(1:50, 5), y = sample(1:50, 5))

# Summarise all columns by their variance except 'group'
df_2 <- df %>%
  summarise(across(!group, var, .names = "{.col}_var"))

df_2
x_var y_var
1 254.3 149.2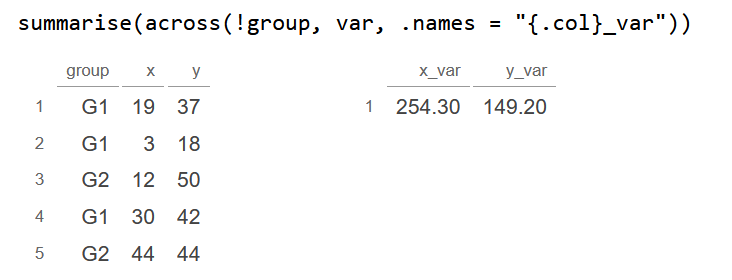
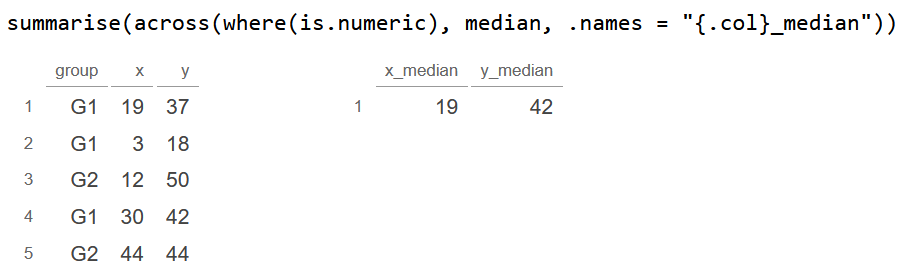
The where function is highly useful as it enables the selection of columns based on a condition, like choosing only numeric columns using where(is.numeric).
For example, the following code calculates the median for all numeric variables.
library(dplyr)

set.seed(9)
df <- data.frame(group = sample(c("G1", "G2"), 5, replace = TRUE),
                 x = sample(1:50, 5), y = sample(1:50, 5))

# Summarise ALL the NUMERIC columns by their median
df_2 <- df %>%
  summarise(across(where(is.numeric), median, .names = "{.col}_median"))

df_2
x_median y_median
1 19 42