Filter rows in R with dplyr
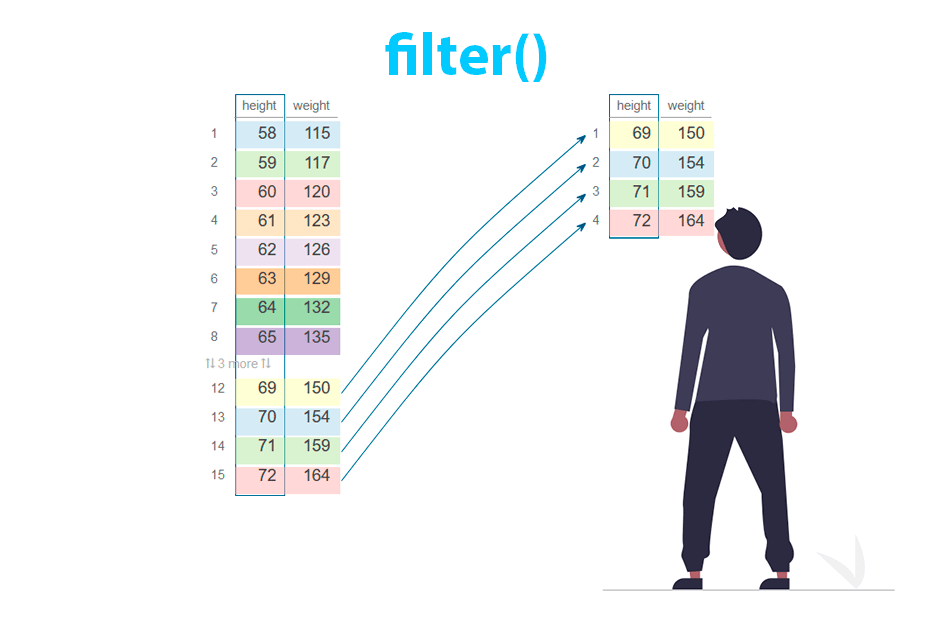
The filter function from dplyr subsets rows of a data frame based on a single or multiple conditions. In this tutorial you will learn how to select rows using comparison and logical operators and how to filter by row number with slice.
Quick answer
To filter rows with dplyr, pass one or more conditions to filter(). The function keeps the rows where all the conditions are TRUE:
library(dplyr)

# Rows where height > 65 AND weight <= 150
women %>% filter(height > 65, weight <= 150)
height weight
1 66 139
2 67 142
3 68 146
4 69 150Use | for OR (filter(height < 60 | height > 70)), ! for NOT and %in% to keep the rows that match any value of a vector (filter(height %in% c(60, 65, 70))). All these options are explained below.
Sample data
The examples inside this tutorial will use the women data set provided by R. This data set contains two numeric columns: height and weight.
# install.packages("dplyr")
library(dplyr)

# Sample data frame
df <- as_tibble(women)

df
# A tibble: 15 × 2
height weight
<dbl> <dbl>
1 58 115
2 59 117
3 60 120
4 61 123
5 62 126
6 63 129
7 64 132
8 65 135
9 66 139
10 67 142
11 68 146
12 69 150
13 70 154
14 71 159
15 72 164Some sections below need missing values, text and dates, which women doesn’t have. For those examples you will use the following sales data frame:
sales <- tibble(
  date    = as.Date(c("2024-01-05", "2024-01-20", "2024-02-03", "2024-02-18", "2024-03-02", "2024-03-15")),
  store   = c("North", "South", "North", "South", "North", "South"),
  product = c("Apple juice", "Orange juice", "Apple pie", "Banana", "Green apple", "Orange"),
  units   = c(10, NA, 7, 15, NA, 12),
  price   = c(2.5, 3, NA, 1.2, 0.8, NA)
)

sales
# A tibble: 6 × 5
date store product units price
<date> <chr> <chr> <dbl> <dbl>
1 2024-01-05 North Apple juice 10 2.5
2 2024-01-20 South Orange juice NA 3
3 2024-02-03 North Apple pie 7 NA
4 2024-02-18 South Banana 15 1.2
5 2024-03-02 North Green apple NA 0.8
6 2024-03-15 South Orange 12 NAFiltering rows based on a single condition
The filter function allows you to subset rows of a data frame based on a condition. You can filter the values equal to, not equal to, lower than or greater than a value by specifying the desired condition within the function.
The following table contains the comparison operators in R and their descriptions.
| Comparison operator | Description |
|---|---|
| > | Greater than |
| < | Lower than |
| >= | Greater or equal than |
| <= | Lower or equal than |
| == | Equal to |
| != | Not equal to |
For example, if you want to filter the rows where the height column is greater than 68 you can write the following:
library(dplyr)

df <- as_tibble(women)

# Rows with 'height' greater than 68
df_2 <- df %>%
  filter(height > 68)

df_2
height weight
<dbl> <dbl>
1 69 150
2 70 154
3 71 159
4 72 164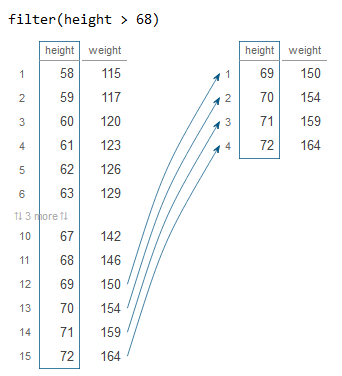
The filtering can be based on a function. The following example selects the rows of the data frame where the height is equal or lower to the mean of the column.
library(dplyr)

df <- as_tibble(women)

# Rows with 'height' lower or equal than the mean
df_2 <- df %>%
  filter(height <= mean(height))

df_2
# A tibble: 8 × 2
height weight
<dbl> <dbl>
1 58 115
2 59 117
3 60 120
4 61 123
5 62 126
6 63 129
7 64 132
8 65 135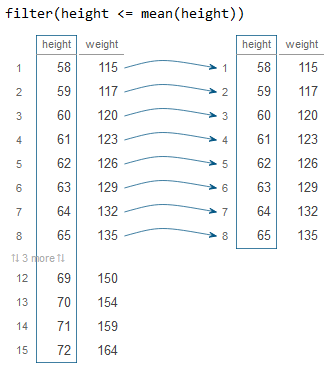
It is also possible to filter rows using logical operators or functions that return TRUE or FALSE or a combination of them. The most common are shown in the table below.
| Operator/function | Description |
|---|---|
| ! | Logical negation ‘NOT’ |
| %in% | In the set |
| !(x %in% y) | x not in y |
| is.na() | Is NA |
| !is.na() | Is not NA |
| grepl() | Contains a pattern |
| !grepl() | Does not contain a pattern |
Filter with %in% and not in
Consider that you want to filter the rows in which the height column takes the value 65, 70 and 72. For this you can use the %in% operator and filter the rows by a vector.
library(dplyr)

df <- as_tibble(women)

# Rows with 'height' equal to 65, 70 and 72
df_2 <- df %>%
  filter(height %in% c(65, 70, 72))

df_2
# A tibble: 3 × 2
height weight
<dbl> <dbl>
1 65 135
2 70 154
3 72 164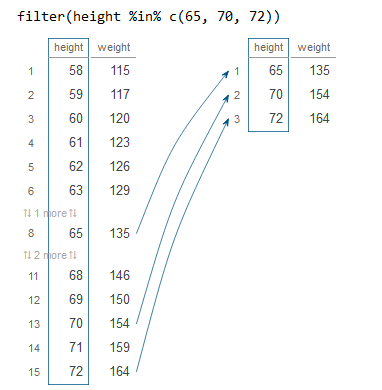
The opposite of a condition can be selected with the logical negation operator !. The example below shows how to select the opposite of the filtering made on the previous code, that is, the rows not in the vector. Note the parentheses: !(height %in% x) negates the whole condition.
library(dplyr)

df <- as_tibble(women)

# Rows with 'height' NOT equal to 65, 70 and 72
df_2 <- df %>%
  filter(!(height %in% c(65, 70, 72)))

df_2
# A tibble: 12 × 2
height weight
<dbl> <dbl>
1 58 115
2 59 117
3 60 120
4 61 123
5 62 126
6 63 129
7 64 132
8 66 139
9 67 142
10 68 146
11 69 150
12 71 159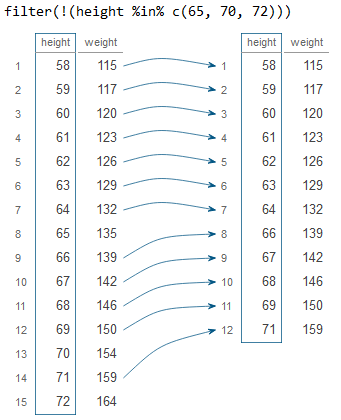
Filter by partial string match
To filter rows containing a specific string you can use grepl or str_detect. The following example filters the rows containing a specific pattern (e.g. rows of height containing a 5).
library(dplyr)

df <- as_tibble(women)

# Rows that contain a 5 inside the values of 'height'
df_2 <- df %>%
  filter(grepl("5", height))

df_2
# A tibble: 3 × 2
height weight
<dbl> <dbl>
1 58 115
2 59 117
3 65 135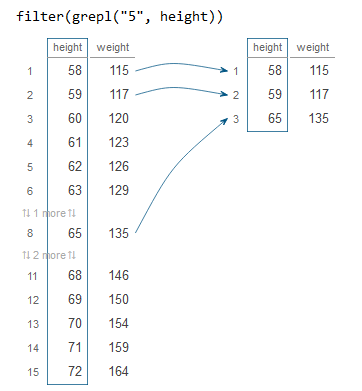
With text columns this is more useful. The following code keeps the products that contain the word “apple”. Set ignore.case = TRUE to match both uppercase and lowercase letters:
sales %>%
  filter(grepl("apple", product, ignore.case = TRUE))
# A tibble: 3 × 5
date store product units price
<date> <chr> <chr> <dbl> <dbl>
1 2024-01-05 North Apple juice 10 2.5
2 2024-02-03 North Apple pie 7 NA
3 2024-03-02 North Green apple NA 0.8The str_detect function from stringr works the same way, but the string goes first and the pattern second. Add ! to keep the rows that don’t contain the pattern:
library(stringr)

# Products that contain "juice"
sales %>%
  filter(str_detect(product, "juice"))

# Products that do NOT contain "apple" (case insensitive)
sales %>%
  filter(!grepl("apple", product, ignore.case = TRUE))
# A tibble: 2 × 5
date store product units price
<date> <chr> <chr> <dbl> <dbl>
1 2024-01-05 North Apple juice 10 2.5
2 2024-01-20 South Orange juice NA 3
# A tibble: 3 × 5
date store product units price
<date> <chr> <chr> <dbl> <dbl>
1 2024-01-20 South Orange juice NA 3
2 2024-02-18 South Banana 15 1.2
3 2024-03-15 South Orange 12 NAMultiple conditions
Row filtering can also be based on multiple conditions to filter, for instance, rows where a value is in a specific range or to filter between dates. For this you will need to use logical operators, such as & to specify one AND another condition, and | to specify one OR another condition.
| Logical operator | Description |
|---|---|
| & | Elementwise logical ‘AND’ |
| | | Elementwise logical ‘OR’ |
| xor() | Elementwise exclusive ‘OR’. TRUE if only one is TRUE |
The example below selects rows whose values in the height column are greater than 65 and lower than 68.
library(dplyr)

df <- as_tibble(women)

# Rows with 'height' greater than 65 AND lower than 68
df_2 <- df %>%
  filter(height > 65 & height < 68)

df_2
# A tibble: 2 × 2
height weight
<dbl> <dbl>
1 66 139
2 67 142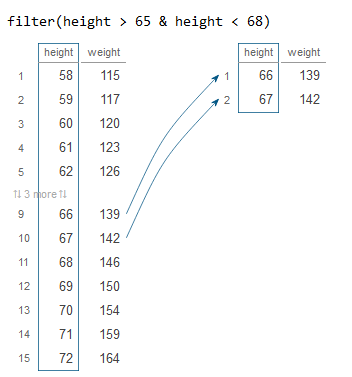
The multiple conditions can be based on multiple columns. In the following block of code we are selecting the rows whose values in height are greater than 65 and whose values in weight are lower or equal to 150.
library(dplyr)

df <- as_tibble(women)

# Rows with 'height' greater than 65 AND weight lower or equal to 150
df_2 <- df %>%
  filter(height > 65 & weight <= 150)

df_2
# A tibble: 4 × 2
height weight
<dbl> <dbl>
1 66 139
2 67 142
3 68 146
4 69 150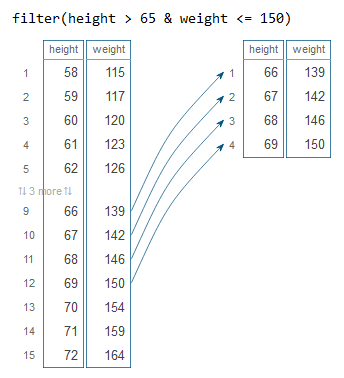
In case you need to subset rows based on a condition OR on another you can use |. The example below filters the rows whose values in height are greater than 65 or whose values in weight are greater or equal to 150.
library(dplyr)

df <- as_tibble(women)

# Rows with 'height' greater than 65 OR 'weight' greater or equal to 150
df_2 <- df %>%
  filter(height > 65 | weight >= 150)

df_2
# A tibble: 7 × 2
height weight
<dbl> <dbl>
1 66 139
2 67 142
3 68 146
4 69 150
5 70 154
6 71 159
7 72 164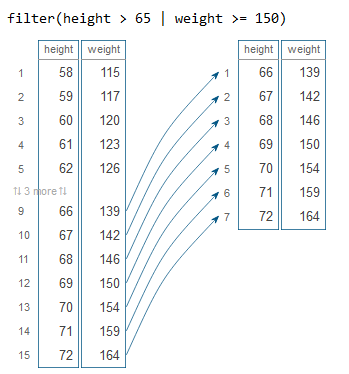
AND with commas
Instead of & you can separate the conditions with commas. filter combines them with AND, so the following code returns the same rows as filter(height > 65 & weight <= 150):
df %>%
  filter(height > 65, weight <= 150)
# A tibble: 4 × 2
height weight
<dbl> <dbl>
1 66 139
2 67 142
3 68 146
4 69 150Commas only mean AND. For OR conditions you always need |, and you can mix both: filter(height > 65, weight < 140 | weight > 160).
NOT: negate several conditions
To keep the rows that don’t meet a combination of conditions, wrap the conditions in parentheses and put ! in front. The following code removes the rows with height between 60 and 70:
df %>%
  filter(!(height >= 60 & height <= 70))
# A tibble: 4 × 2
height weight
<dbl> <dbl>
1 58 115
2 59 117
3 71 159
4 72 164Filter values in a range with between
The between function from dplyr is a shortcut for x >= left & x <= right. Note that both limits are included, unlike the height > 65 & height < 68 example above:
df %>%
  filter(between(height, 65, 68))
# A tibble: 4 × 2
height weight
<dbl> <dbl>
1 65 135
2 66 139
3 67 142
4 68 146Use !between(height, 65, 68) to keep the values outside the range.
Filter by date range
Date columns can be filtered with the same comparison operators, as long as the column is of class Date and you compare it with another date, not with a character string. Use as.Date to create the limits:
sales %>%
  filter(date >= as.Date("2024-02-01") & date <= as.Date("2024-02-29"))
# A tibble: 2 × 5
date store product units price
<date> <chr> <chr> <dbl> <dbl>
1 2024-02-03 North Apple pie 7 NA
2 2024-02-18 South Banana 15 1.2between also works with dates, so the code below is equivalent and returns the same two rows:
sales %>%
  filter(between(date, as.Date("2024-02-01"), as.Date("2024-02-29")))
Filter NA and non-NA values
Use is.na to keep the rows with a missing value in a column and !is.na to remove them:
# Rows where 'units' is NA
sales %>%
  filter(is.na(units))

# Rows where 'units' is not NA
sales %>%
  filter(!is.na(units))
# A tibble: 2 × 5
date store product units price
<date> <chr> <chr> <dbl> <dbl>
1 2024-01-20 South Orange juice NA 3
2 2024-03-02 North Green apple NA 0.8
# A tibble: 4 × 5
date store product units price
<date> <chr> <chr> <dbl> <dbl>
1 2024-01-05 North Apple juice 10 2.5
2 2024-02-03 North Apple pie 7 NA
3 2024-02-18 South Banana 15 1.2
4 2024-03-15 South Orange 12 NAKeep in mind that filter drops the rows where the condition is NA. NA > 8 is NA, not TRUE, so the rows with a missing value in units disappear even if you didn’t ask to remove them:
sales %>%
  filter(units > 8)
# A tibble: 3 × 5
date store product units price
<date> <chr> <chr> <dbl> <dbl>
1 2024-01-05 North Apple juice 10 2.5
2 2024-02-18 South Banana 15 1.2
3 2024-03-15 South Orange 12 NAIf you want to keep the missing values, add them explicitly with | is.na():
sales %>%
  filter(units > 8 | is.na(units))
# A tibble: 5 × 5
date store product units price
<date> <chr> <chr> <dbl> <dbl>
1 2024-01-05 North Apple juice 10 2.5
2 2024-01-20 South Orange juice NA 3
3 2024-02-18 South Banana 15 1.2
4 2024-03-02 North Green apple NA 0.8
5 2024-03-15 South Orange 12 NALearn more about how to work with NA values in R.
Filter by group
When the data is grouped with group_by, the conditions are evaluated within each group. The following code keeps the rows where units is greater than the average of its own store:
sales %>%
  group_by(store) %>%
  filter(units > mean(units, na.rm = TRUE))
# A tibble: 2 × 5
# Groups: store [2]
date store product units price
<date> <chr> <chr> <dbl> <dbl>
1 2024-01-05 North Apple juice 10 2.5
2 2024-02-18 South Banana 15 1.2The mean of North is 8.5 and the mean of South is 13.5, so only one row per store is kept. Since dplyr 1.1.0 you can also use the .by argument, which returns an ungrouped data frame: filter(units > mean(units, na.rm = TRUE), .by = store).
Filter across several columns with if_any and if_all
If you need to apply the same condition to several columns, use if_any (keep the row if the condition is TRUE in at least one column) or if_all (keep the row if it is TRUE in all of them). For instance, you can keep the rows with a missing value in units or price:
sales %>%
  filter(if_any(c(units, price), is.na))
# A tibble: 4 × 5
date store product units price
<date> <chr> <chr> <dbl> <dbl>
1 2024-01-20 South Orange juice NA 3
2 2024-02-03 North Apple pie 7 NA
3 2024-03-02 North Green apple NA 0.8
4 2024-03-15 South Orange 12 NAThe following code keeps the rows where all the selected columns are greater than 2. You can pass an anonymous function with ~ and .x:
sales %>%
  filter(if_all(c(units, price), ~ .x > 2))
# A tibble: 1 × 5
date store product units price
<date> <chr> <chr> <dbl> <dbl>
1 2024-01-05 North Apple juice 10 2.5Use if_all(c(units, price), ~ !is.na(.x)) to keep only the rows with no missing values in those columns. You can also select the columns with helpers such as where(is.numeric) or starts_with("x"), as in the select function.
Filter by row number with slice
A similar function related to filter is slice, which allows you to filter rows based on its index/position. The function takes a sequence or vector of indices (integers) as input, as shown below.
library(dplyr)

df <- as_tibble(women)

# First three rows
df_2 <- df %>%
  slice(1:3)

df_2
# A tibble: 3 × 2
height weight
<dbl> <dbl>
1 58 115
2 59 117
3 60 120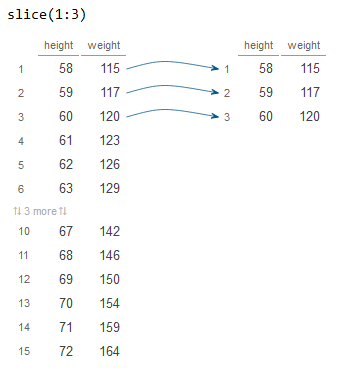
In addition, the slice_head function allows you to select the first row of the data frame. This function provides an argument named n to select the n first rows.
library(dplyr)

df <- as_tibble(women)

# First row
df_2 <- df %>%
  slice_head()

df_2
# A tibble: 1 × 2
height weight
<dbl> <dbl>
1 58 115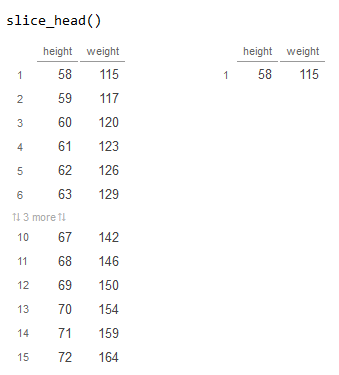
Finally, if you need to select the last row you can use slice_tail. This function also provides an argument named n to select the last n rows of the data frame.
library(dplyr)

df <- as_tibble(women)

# Last row
df_2 <- df %>%
  slice_tail()

df_2
# A tibble: 1 × 2
height weight
<dbl> <dbl>
1 72 164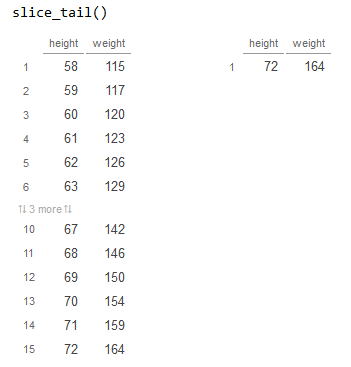
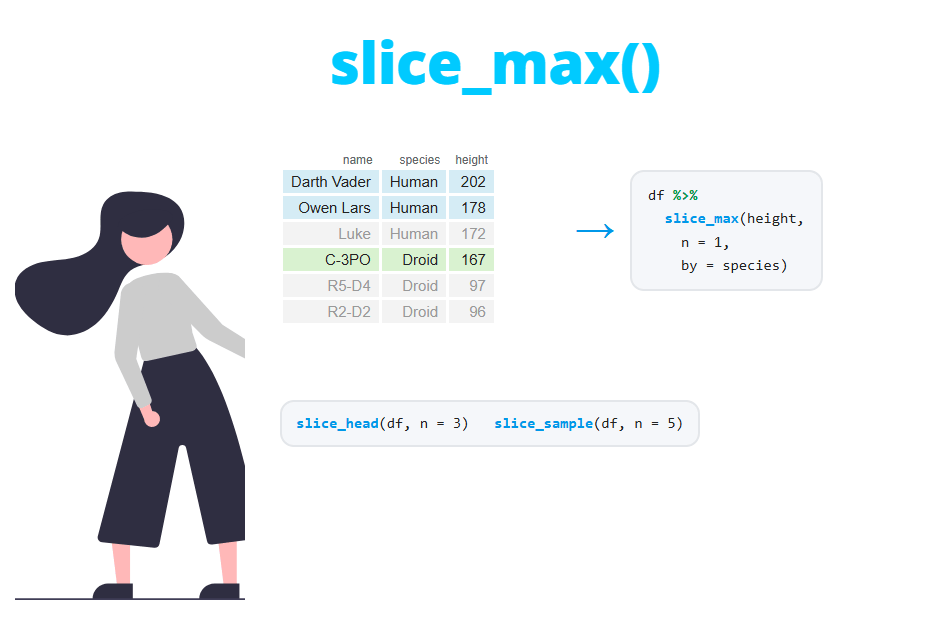
slice_sample selects rows randomly and slice_min and slice_max select the rows with the lowest or highest values of a variable, respectively. Learn more in the slice tutorial.
Common errors
Using = instead of ==
Inside filter you need the comparison operator ==. If you write a single = dplyr understands it as a named argument and throws this error:
df %>%
  filter(height = 65)
Error in `filter()`:
! We detected a named input.
ℹ This usually means that you've used `=` instead of `==`.
ℹ Did you mean `height == 65`?Write filter(height == 65) instead.
Error: object not found (stats::filter)
R includes another function called filter in the stats package, used to filter time series. If dplyr is not loaded, R calls stats::filter, which doesn’t know your column names:
women |> filter(height > 68)Error: object 'height' not foundLoad the package with library(dplyr) before using filter, or call it as dplyr::filter(). This is also why you see the message The following objects are masked from 'package:stats': filter, lag when loading dplyr. If you load another package that also has a filter function after dplyr, use dplyr::filter() to avoid conflicts.
Using && or || instead of & or |
&& and || only work with single values. Inside filter you must use the elementwise operators & and |, or you will get an error like this:
df %>%
  filter(height > 65 && weight < 150)
Error in `filter()`:
ℹ In argument: `height > 65 && weight < 150`.
Caused by error in `height > 65 && weight < 150`:
! 'length = 15' in coercion to 'logical(1)'