Create and modify columns in R with the mutate() function from dplyr
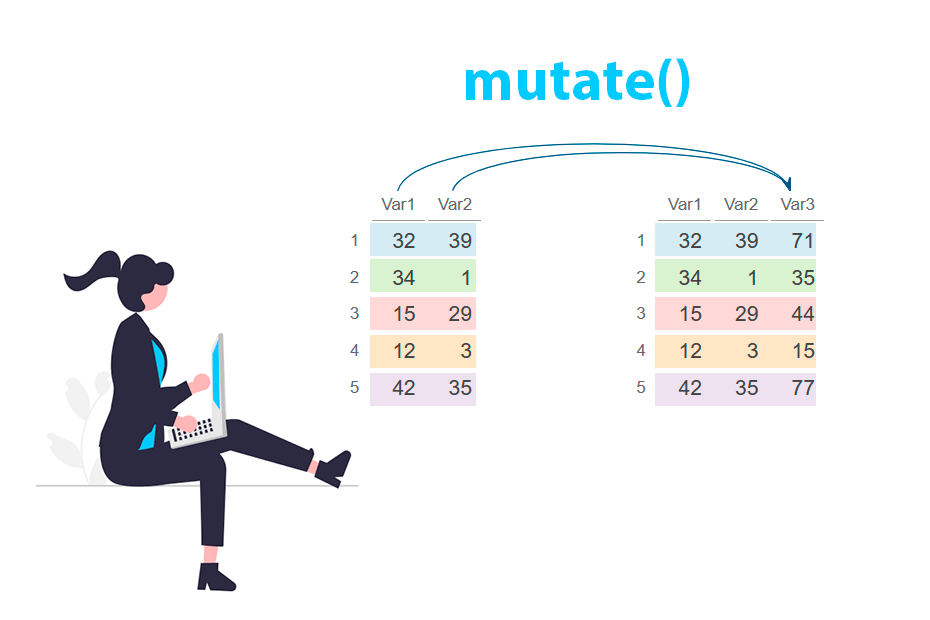
The mutate function from dplyr package is used to create new columns or modify existing columns in a data frame, while retaining the original structure. It enables users to apply functions or operations to data within a data frame and store the results as new variables. To add columns that come from another data frame, use a join.
Quick answer
Use mutate(data, new_column = expression) to add a new column and mutate(data, existing_column = expression) to overwrite an existing one. You can create several columns in the same call by separating them with commas:
library(dplyr)

df <- data.frame(Var1 = c(32, 34, 15), Var2 = c(39, 1, 29))

df %>%
  mutate(Var3 = Var1 + Var2,  # New column
         Var1 = Var1 * 2)     # Modify an existing column
Var1 Var2 Var3
1 64 39 71
2 68 1 35
3 30 29 44Syntax
The syntax of the mutate function is the following:
# Basic usage
mutate(.data, new_column_name = expression)


mutate(
  .data,  # Data set
  ...,    # New columns (new_column_name = expression)
  .by = NULL, # Grouping variables
  .keep = c("all", "used", "unused", "none"), # Which columns to keep
  .before = NULL, # New columns will appear before this
  .after = NULL   # New columns will appear after this
)
Create columns
To create a new column you can specify the new column name (Var3) and an expression to calculate the values of the new column. In the example below the expression is the sum of two other columns (Var1 + Var2).
library(dplyr)

set.seed(8)
df <- data.frame(Var1 = sample(1:50, 5), Var2 = sample(1:50, 5))

# New column with the sum of 'Var1' and 'Var2'
df_2 <- df %>%
  mutate(Var3 = Var1 + Var2)

df_2
Var1 Var2 Var3
1 32 39 71
2 34 1 35
3 15 29 44
4 12 3 15
5 42 35 77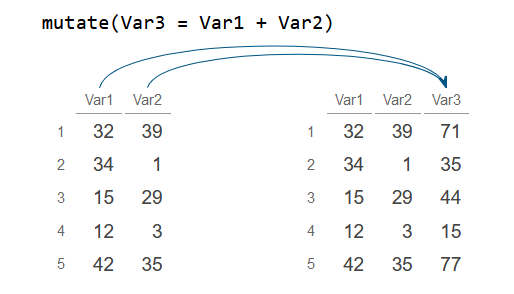
You can also apply a function to a column to create a new one. The following example illustrates how to create a new column with the square root of another.
library(dplyr)

set.seed(8)
df <- data.frame(Var1 = sample(1:50, 5), Var2 = sample(1:50, 5))

# New column with the square root of 'Var1'
df_2 <- df %>%
  mutate(Sqrt_Var1 = sqrt(Var1))

df_2
Var1 Var2 Sqrt_Var1
1 32 39 5.656854
2 34 1 5.830952
3 15 29 3.872983
4 12 3 3.464102
5 42 35 6.480741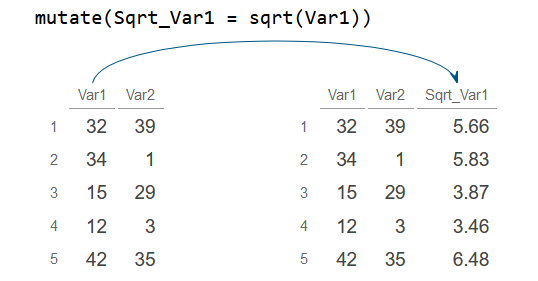
Add multiple columns at once
Notice that you can add several columns simultaneously by passing more expressions separated by commas to mutate.
library(dplyr)

set.seed(8)
df <- data.frame(Var1 = sample(1:50, 5), Var2 = sample(1:50, 5))

# Create three new columns named 'Var3', 'Var4' and 'Var5'
df_2 <- df %>%
  mutate(Var3 = Var1 + Var2,
         Var4 = cumsum(Var1),
         Var5 = ifelse(Var1 > Var2, TRUE, FALSE))

df_2
Var1 Var2 Var3 Var4 Var5
1 32 39 71 32 FALSE
2 34 1 35 66 TRUE
3 15 29 44 81 FALSE
4 12 3 15 93 TRUE
5 42 35 77 135 TRUE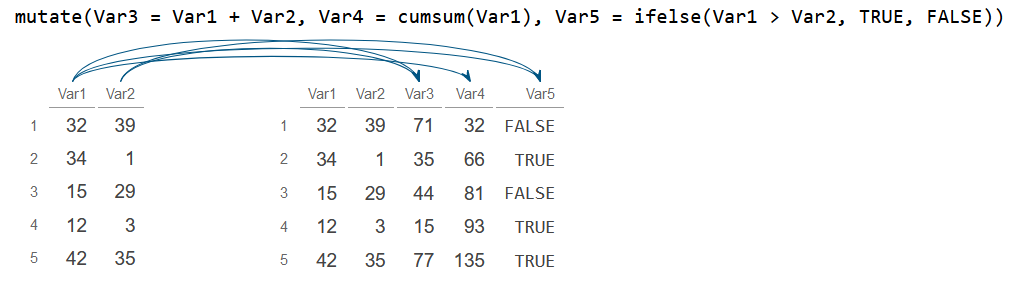
Using across
The across function allows you to select specific columns with helper functions while using mutate.
In the following example, the sqrt function is applied to all columns containing "1" in their names. Subsequently, the new columns are named using the previous column name ("{.col}") followed by a suffix ("_sqrt").
library(dplyr)

set.seed(8)
df <- data.frame(Var1 = sample(1:50, 5), Var2 = sample(1:50, 5))

# Create new columns with all columns that contain "1" in their names
df_2 <- df %>%
  mutate(across(contains("1"), sqrt, .names = "{.col}_sqrt"))

df_2
Var1 Var2 Var1_sqrt
1 32 39 5.656854
2 34 1 5.830952
3 15 29 3.872983
4 12 3 3.464102
5 42 35 6.480741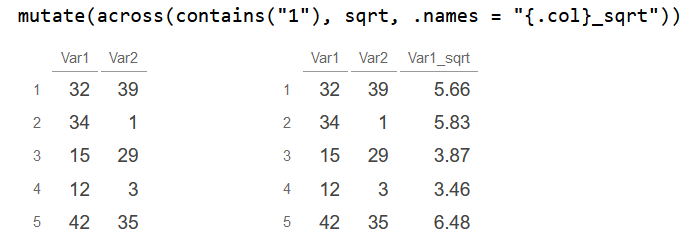
Conditional mutate with if_else and case_when
A very common task is to create a column whose value depends on a condition. Inside mutate you can use if_else (the dplyr version of the base R ifelse function) when there are only two possible outcomes.
library(dplyr)

set.seed(8)
df <- data.frame(Var1 = sample(1:50, 5), Var2 = sample(1:50, 5))

# Which column is bigger in each row?
df_2 <- df %>%
  mutate(Bigger = if_else(Var1 > Var2, "Var1", "Var2"))

df_2
Var1 Var2 Bigger
1 32 39 Var2
2 34 1 Var1
3 15 29 Var2
4 12 3 Var1
5 42 35 Var1When you have more than two conditions, nesting if_else calls gets hard to read. Use the case_when function instead. The conditions are evaluated in order and .default sets the value for the rows that don’t match any condition.
library(dplyr)

set.seed(8)
df <- data.frame(Var1 = sample(1:50, 5), Var2 = sample(1:50, 5))

# Classify 'Var1' into three categories
df_2 <- df %>%
  mutate(Size = case_when(Var1 < 20 ~ "Small",
                          Var1 < 40 ~ "Medium",
                          .default = "Large"))

df_2
Var1 Var2 Size
1 32 39 Medium
2 34 1 Medium
3 15 29 Small
4 12 3 Small
5 42 35 LargeModify existing columns
The mutate function is also capable of modifying existing columns. To achieve this, simply use the syntax: old_column_name = expression
library(dplyr)

set.seed(8)
df <- data.frame(Var1 = sample(1:50, 5), Var2 = sample(1:50, 5))

# Modify 'Var1' as its value divided by the mean of the column
df_2 <- df %>%
  mutate(Var1 = Var1 / mean(Var1, na.rm = TRUE))

df_2
Var1 Var2
1 1.1851852 39
2 1.2592593 1
3 0.5555556 29
4 0.4444444 3
5 1.5555556 35Modify multiple columns
With across, you can select specific columns and apply a custom function to them without creating new columns. The example below demonstrates how to apply the log function to all columns except for Var1.
library(dplyr)

set.seed(8)
df <- data.frame(Var1 = sample(1:50, 5), Var2 = sample(1:50, 5))

# Apply log to all columns but 'Var1'
df_2 <- df %>%
  mutate(across(!Var1, log))

df_2
Var1 Var2
1 32 3.663562
2 34 0.000000
3 15 3.367296
4 12 1.098612
5 42 3.555348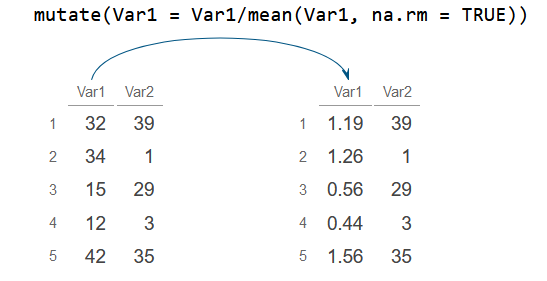
In such cases where the desired function takes additional arguments, you will need to use ~ before the function and reference . to represent the column values.
library(dplyr)

set.seed(8)
df <- data.frame(Var1 = sample(1:50, 5), Var2 = sample(1:50, 5))

# Modify all columns but 'Var1' with paste0
df_2 <- df %>%
  mutate(across(!Var1, ~paste0("Value: ", .)))

df_2
Var1 Var2
1 32 Value: 39
2 34 Value: 1
3 15 Value: 29
4 12 Value: 3
5 42 Value: 35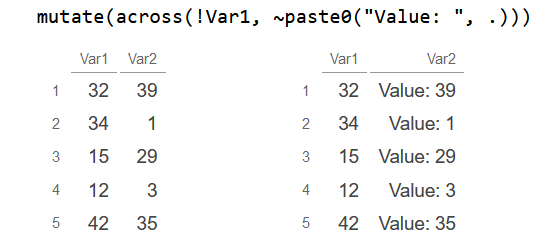
mutate_at, mutate_if and mutate_all
In older code you will often find the mutate_at, mutate_if and mutate_all functions. They still work, but they are superseded: since dplyr 1.0.0 the recommended way is to use mutate together with across. The table below shows the equivalences:
| Old function | Modern equivalent with across |
|---|---|
mutate_at(vars(Var1), f) |
mutate(across(Var1, f)) |
mutate_if(is.numeric, f) |
mutate(across(where(is.numeric), f)) |
mutate_all(f) |
mutate(across(everything(), f)) |
For instance, the following two lines apply the square root to all the numeric columns and return the same result:
library(dplyr)

set.seed(8)
df <- data.frame(Var1 = sample(1:50, 5), Var2 = sample(1:50, 5))

# Old style
df %>% mutate_if(is.numeric, sqrt)

# Modern style
df %>% mutate(across(where(is.numeric), sqrt))
Var1 Var2
1 5.656854 6.244998
2 5.830952 1.000000
3 3.872983 5.385165
4 3.464102 1.732051
5 6.480741 5.916080The same applies to mutate_at. Note that in the modern syntax you can write the anonymous function with .x instead of .:
library(dplyr)

set.seed(8)
df <- data.frame(Var1 = sample(1:50, 5), Var2 = sample(1:50, 5))

# Old style
df %>% mutate_at(vars(Var1), ~ . * 10)

# Modern style
df %>% mutate(across(Var1, ~ .x * 10))
Var1 Var2
1 320 39
2 340 1
3 150 29
4 120 3
5 420 35Mutate by group
By default, functions such as mean or sum inside mutate use the whole column. If you group the data first with the group_by function, the calculations are made within each group but, unlike summarise, all the rows are kept.
In the example below, Mean is the average of Value in each group and Diff is the difference between each value and the mean of its group.
library(dplyr)

set.seed(8)
df <- data.frame(Group = c("A", "A", "B", "B", "B"),
                 Value = sample(1:50, 5))

# Mean of each group and difference with that mean
df_2 <- df %>%
  group_by(Group) %>%
  mutate(Mean = mean(Value), Diff = Value - Mean)

df_2
# A tibble: 5 × 4
# Groups: Group [2]
Group Value Mean Diff
<chr> <int> <dbl> <dbl>
1 A 32 33 -1
2 A 34 33 1
3 B 15 23 -8
4 B 12 23 -11
5 B 42 23 19Notice that the output is still grouped (# Groups: Group [2]). Remember to use ungroup when you are done, or any later operation will also work by group.
Since dplyr 1.1.0 you can also use the .by argument of mutate, which groups only for that operation and returns an ungrouped data frame. Check the differences between .by and group_by for more details.
library(dplyr)

set.seed(8)
df <- data.frame(Group = c("A", "A", "B", "B", "B"),
                 Value = sample(1:50, 5))

# Same calculation using the .by argument
df_2 <- df %>%
  mutate(Mean = mean(Value), Diff = Value - Mean, .by = Group)

df_2
Group Value Mean Diff
1 A 32 33 -1
2 A 34 33 1
3 B 15 23 -8
4 B 12 23 -11
5 B 42 23 19Position of the new columns
By default, when you use mutate to create a new column, it appends that column to the end of the data frame. Nevertheless, the mutate function allows for the use of .before or .after arguments to control the position of the new columns relative to other columns.
In the example below, a new column is added before Var2:
library(dplyr)

set.seed(8)
df <- data.frame(Var1 = sample(1:50, 5), Var2 = sample(1:50, 5))

# New column before 'Var2'
df_2 <- df %>%
  mutate(Var3 = Var1 / Var2, .before = Var2)

df_2
Var1 Var3 Var2
1 32 0.8205128 39
2 34 34.0000000 1
3 15 0.5172414 29
4 12 4.0000000 3
5 42 1.2000000 35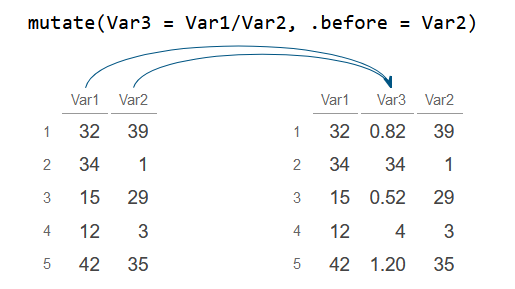
Additionally, you can specify positions based on the index of the column. For instance, setting .before = 1 will add the new column as the first column.
library(dplyr)

set.seed(8)
df <- data.frame(Var1 = sample(1:50, 5), Var2 = sample(1:50, 5))

# New column on the first position (before first column)
df_2 <- df %>%
  mutate(Var3 = Var1 / Var2, .before = 1)

df_2
Var3 Var1 Var2
1 0.8205128 32 39
2 34.0000000 34 1
3 0.5172414 15 29
4 4.0000000 12 3
5 1.2000000 42 35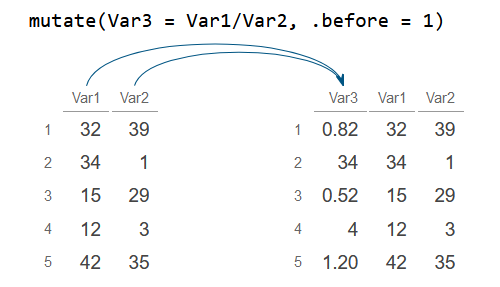
In the example below, setting .after = "Var2" will place the new column after Var2.
library(dplyr)

set.seed(8)
df <- data.frame(Var1 = sample(1:50, 5), Var2 = sample(1:50, 5))

# New column after 'Var2'
df_2 <- df %>%
  mutate(Var3 = Var1 * Var2, .after = "Var2")

df_2
Var1 Var2 Var3
1 32 39 1248
2 34 1 34
3 15 29 435
4 12 3 36
5 42 35 1470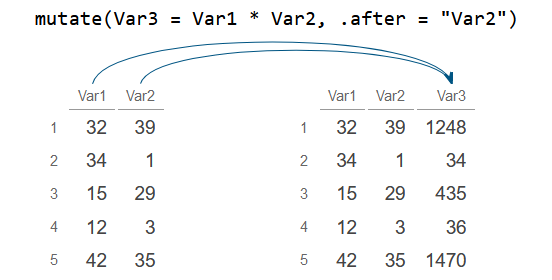
Keep or drop columns
When you add new columns to a data frame all other columns are preserved by default. However, the .keep argument, which defaults to "all", can also be set to "used" to only keep columns used inside mutate, to "unused" to keep unused columns and to "none" to delete all the old columns.
The following example demonstrates how to use .keep by retaining only used columns.
library(dplyr)

set.seed(8)
df <- data.frame(Var1 = sample(1:50, 5), Var2 = sample(1:50, 5))

# New column and keep the new column ('Var3') and the column used ('Var1')
df_2 <- df %>%
  mutate(Var3 = Var1 * 2, .keep = "used")

df_2
Var1 Var3
1 32 64
2 34 68
3 15 30
4 12 24
5 42 84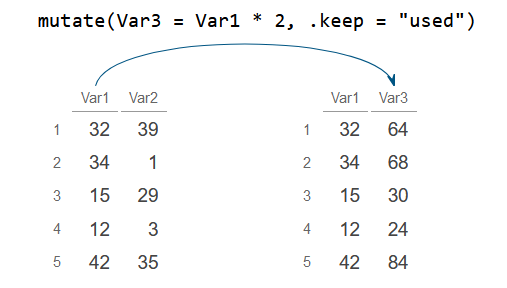
The opposite is to keep only the new column and the columns that haven’t been used setting .keep = "unused".
library(dplyr)

set.seed(8)
df <- data.frame(Var1 = sample(1:50, 5), Var2 = sample(1:50, 5))

# New column and keep the new column ('Var3') and the column unused ('Var2')
df_2 <- df %>%
  mutate(Var3 = Var1 * 2, .keep = "unused")

df_2
Var2 Var3
1 39 64
2 1 68
3 29 30
4 3 24
5 35 84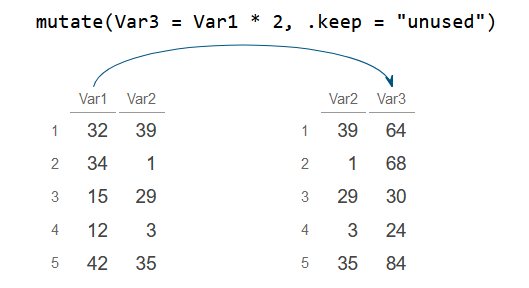
Finally, to remove all columns from the original data frame, use .keep = "none".
library(dplyr)

set.seed(8)
df <- data.frame(Var1 = sample(1:50, 5), Var2 = sample(1:50, 5))

# New column and only keep the new column ('Var3')
df_2 <- df %>%
  mutate(Var3 = Var1 * 2, .keep = "none")

df_2
Var3
1 64
2 68
3 30
4 24
5 84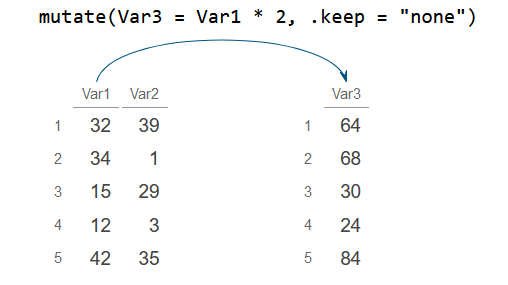
mutate vs transmute
The transmute function creates new columns like mutate, but it only keeps the new columns and drops the rest. Today transmute is superseded and the recommended way to obtain the same result is mutate with .keep = "none". The following two codes are equivalent:
library(dplyr)

set.seed(8)
df <- data.frame(Var1 = sample(1:50, 5), Var2 = sample(1:50, 5))

# With transmute
df %>% transmute(Var3 = Var1 + Var2)

# With mutate
df %>% mutate(Var3 = Var1 + Var2, .keep = "none")
Var3
1 71
2 35
3 44
4 15
5 77In summary: use mutate when you want to add columns to your data and mutate(..., .keep = "none") (or transmute) when you only want the new columns.
Common errors
Error: object not found
Inside mutate you can only reference columns of the data frame you are modifying (or objects of your environment). If you try to use a column that belongs to another data frame you will get the following error:
library(dplyr)

set.seed(8)
df <- data.frame(Var1 = sample(1:50, 5), Var2 = sample(1:50, 5))
df_other <- data.frame(Var5 = 1:5)

df %>% mutate(Var3 = Var1 + Var5)
Error in `mutate()`:
ℹ In argument: `Var3 = Var1 + Var5`.
Caused by error:
! object 'Var5' not foundThe same error appears if you misspell a column name. If the column lives in another data frame, the safest fix is to bring it in with a join using a common key. If both data frames have the same rows in the same order you can also reference it with $, as in mutate(Var3 = Var1 + df_other$Var5).
Error: must be size N or 1
The new column must have one value per row or a single value, which is recycled to all rows. Any other length throws an error:
library(dplyr)

set.seed(8)
df <- data.frame(Var1 = sample(1:50, 5), Var2 = sample(1:50, 5))

df %>% mutate(Var3 = c(1, 2))
Error in `mutate()`:
ℹ In argument: `Var3 = c(1, 2)`.
Caused by error:
! `Var3` must be size 5 or 1, not 2.To fix it, make sure the vector has as many elements as rows (5 here) or use a single value, for instance mutate(Var3 = 0). When the data is grouped, the size must match the number of rows of each group.
Error: can’t combine true and false
Unlike base ifelse, if_else is strict about types: the values for TRUE and FALSE must be of the same type.
library(dplyr)

set.seed(8)
df <- data.frame(Var1 = sample(1:50, 5), Var2 = sample(1:50, 5))

df %>% mutate(Var3 = if_else(Var1 > 20, "High", 0))
Error in `mutate()`:
ℹ In argument: `Var3 = if_else(Var1 > 20, "High", 0)`.
Caused by error in `if_else()`:
! Can't combine `true` <character> and `false` <double>.Use values of the same type, such as if_else(Var1 > 20, "High", "Low").