Logarithm and exponential in R
Logarithms and exponential can be computed making use of the functions provided by R: the log function for natural logarithms, log2 and log10 for base 2 and 10 logarithms, respectively, log1p to compute log(1 + x) and the exp function to compute the exponential function and expm1 to calculate exp(x) - 1.
log()
The basic R function to compute logarithms is log, which calculates natural logarithms. The syntax of the function is as follows.
log(x, base = exp(1))Note that the base argument allows you to customize the base of the logarithm. In the following block of code you can see some examples.
log(8)
log(0)
log(1)
log(10)
log(12, base = 2)
2.079442
-Inf
0
2.302585
3.584963You can make use of the plot function to represent the values of a natural logarithm:
plot(log, 0, 100, col = 4, main = "log(x)")
segments(x0 = exp(1), y0 = 0, x1 = exp(1), y1 = 1, lty = 2)
segments(x0 = 0, y0 = 1, x1 = exp(1), y1 = 1, lty = 2)
points(exp(1), 1, pch = 16)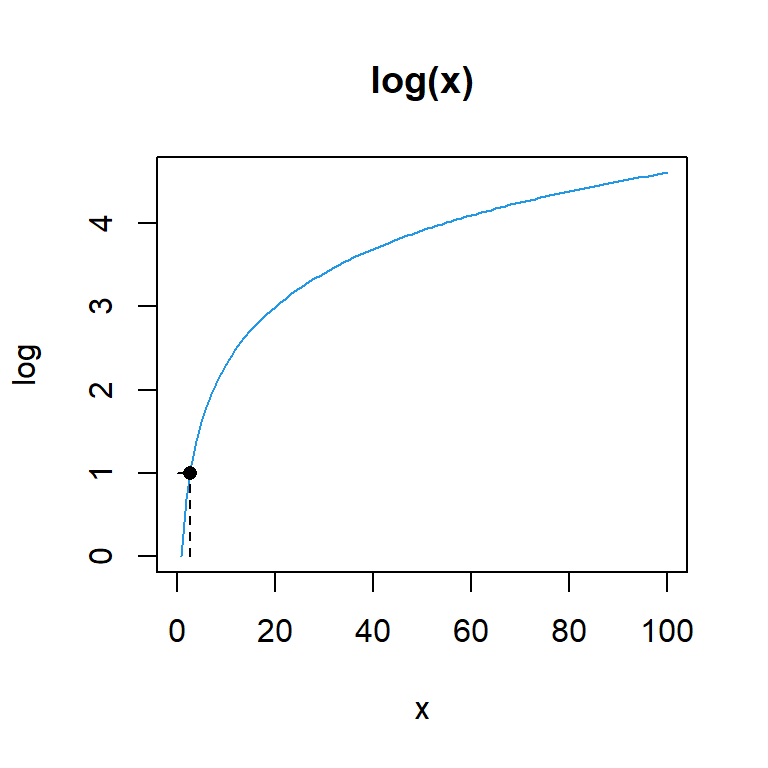
log2()
The log2 function calculates a logarithm with base 2 and is equivalent to log(x, base = 2).
log2(10)
log(10, base = 2) # Equivalent
3.321928
3.321928You can see a visual representation of the logarithm of base 2 from 0 to 100 in the following chart:
plot(log2, 0, 100, col = 4, main = "log2(x)")
segments(x0 = 2, y0 = 0, x1 = 2, y1 = 1, lty = 2)
segments(x0 = 0, y0 = 1, x1 = 2, y1 = 1, lty = 2)
points(2, 1, pch = 16)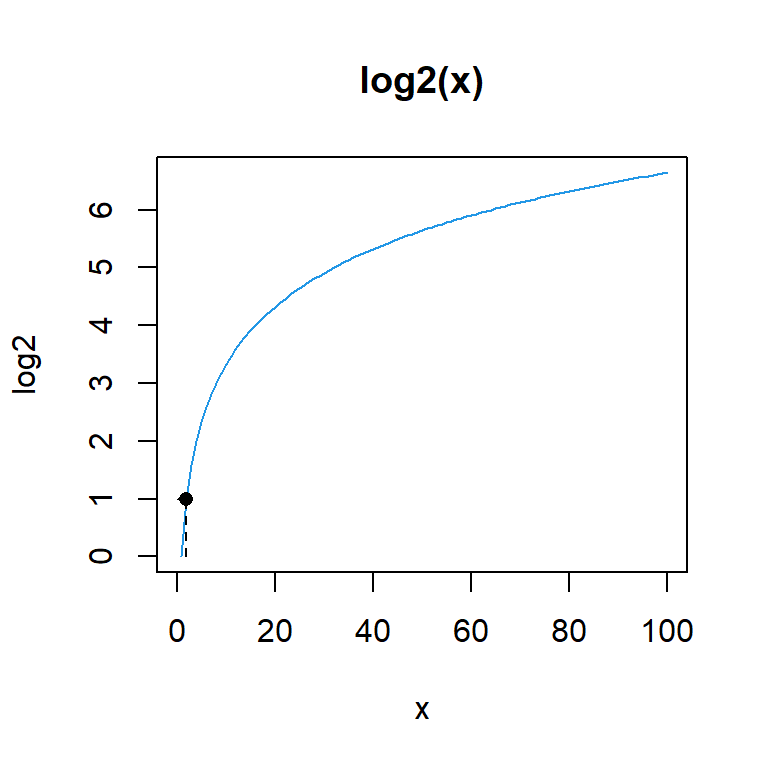
log10()
The log10 function is a wrapper of log(x, base = 10) and computes a logarithm of base 10.
log10(10)
log(10, base = 10) # Equivalent
1
1You can plot this function with the following block of code:
plot(log10, 0, 100, col = 4, main = "log10(x)")
segments(x0 = 10, y0 = 0, x1 = 10, y1 = 1, lty = 2)
segments(x0 = 0, y0 = 1, x1 = 10, y1 = 1, lty = 2)
points(10, 1, pch = 16)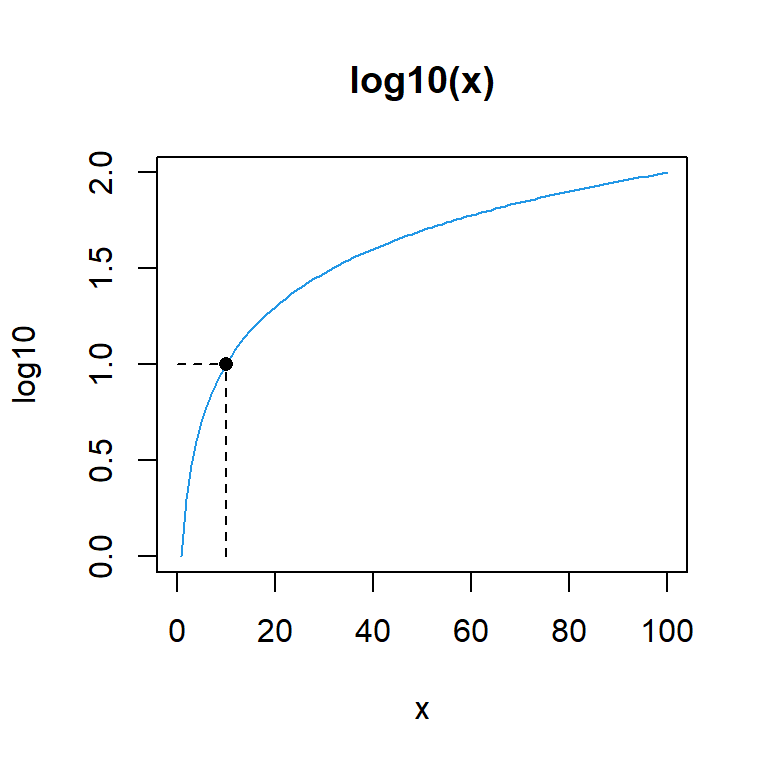
log1p()
The log1p() function computes log(1 + x), accurately also for |x| ≪ 1.
# log(10)
log(10)

# log(1 + 10)
log1p(10)

# log(11)
log(11)
2.302585
2.397895
2.397895You can plot this function with the following line of code:
plot(log1p, -0.99, 10, col = 4, main = "log1p(x)")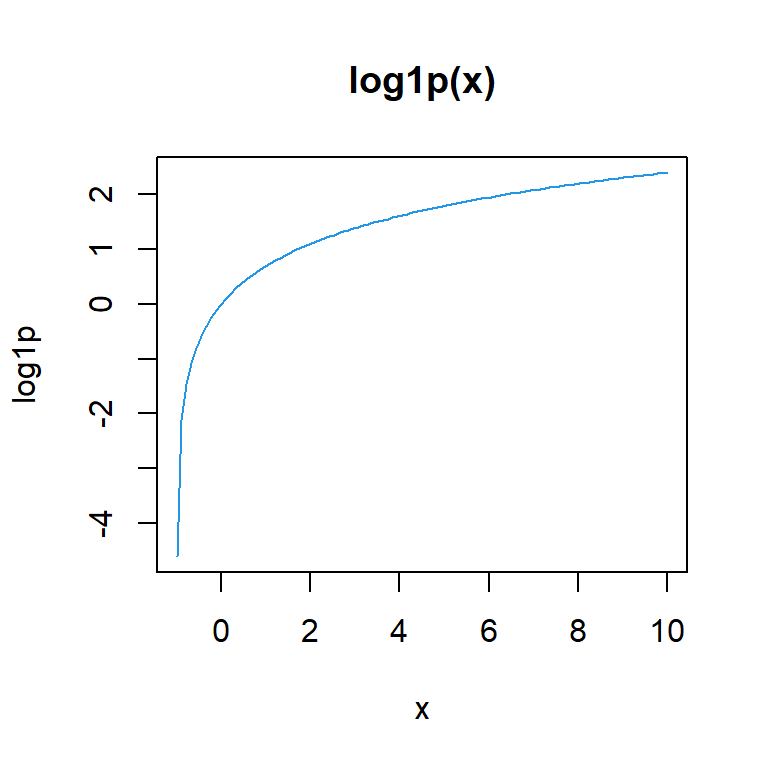
exp()
The exp function in R computes the exponential function, which is the inverse of the natural logarithm. The following block contains some examples of the usage of the exp function.
exp(10)
exp(0)
exp(-5)
exp(4)
22026.47
1
0.006737947
54.59815You can also plot the exponential function making use of the plot function as shown below:
plot(exp, -10, 10, col = 4, main = "exp(x)")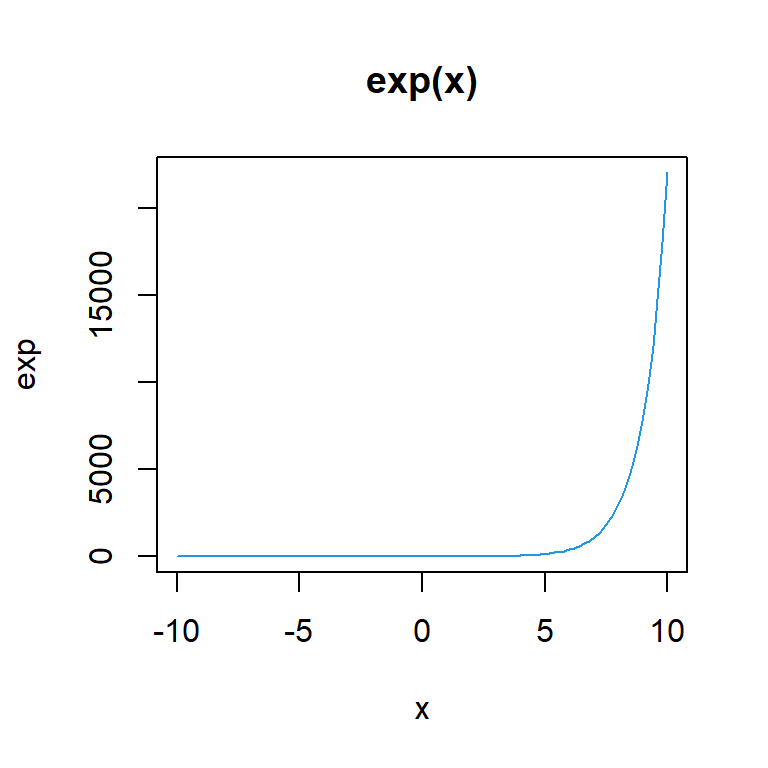
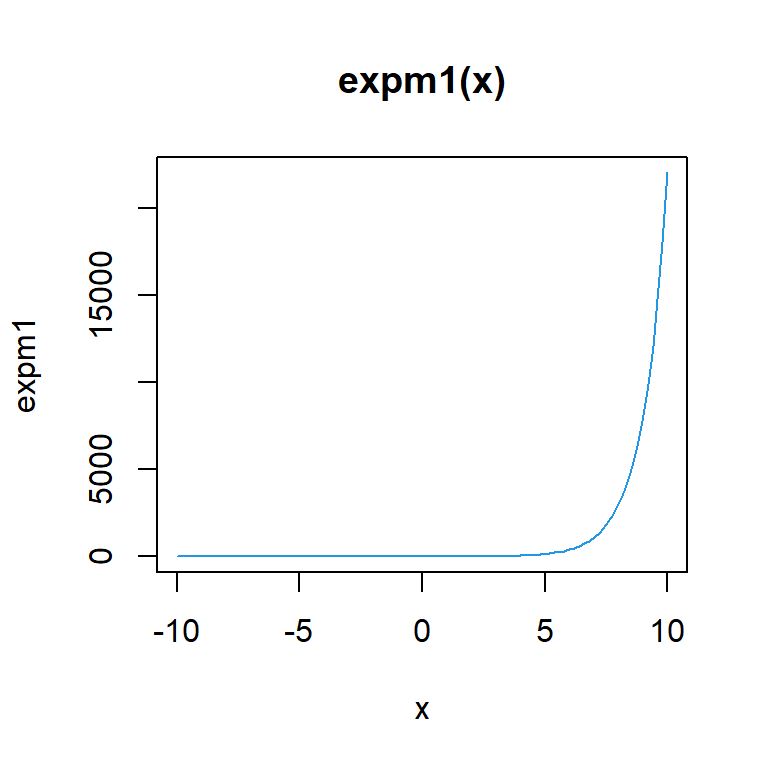
expm1()
The expm1 function computes exp(x) -1, accurately also for |x| ≪ 1.
expm1(5)
exp(5) - 1

expm1(0.15)
exp(0.15) - 1
147.4132
147.4132
0.1618342
0.1618342You can use the following line of code to plot this function for different values.
plot(expm1, -10, 10, col = 4, main = "expm1(x)")