Add custom fonts in R
When creating graphics in R you can specify a font family. The integrated fonts in R are sans (Arial), serif (Times New Roman), mono (Courier) and symbol (Standard Symbols L). However, it is possible to add custom fonts in R with the extrafont or the showtext packages.
The extrafont package
The extrafont package allows adding True Font Type (.ttf) fonts to R easily. Before loading the package, we recommend you to install all the fonts you want in your system. For that purpose you will need to download them from any source and install them with right click – Install for all users.
Import the system custom fonts
Once you have all the desired fonts installed, the first time after installing the package you will need to run the font_import function, which will import all the .ttf fonts of your system.
# install.packages("extrafont")
library(extrafont)

# Import all the .ttf files from your system
# You will only need to run this once, but it will take a few minutes to finish
font_import()
After running the previous function, you can see the full list of fonts available in alphabetical order running fonts().
# Show the full list
# fonts()

# Only the first six fonts
head(fonts())
[1] "Agency FB" "Alba Matter" "Alba Super"
[4] "Algerian" "Alte Haas Grotesk" "Arial Black"Now check if all the fonts you want to use are on the list. If not, we recommend the following workflow:
-
Copy the
.ttffiles of the missing fonts and paste them on a folder. -
Copy the folder path and run
font_import(path = "The_Folder_Path").
Using the custom fonts
After importing all the fonts, you will need to register them with the loadfonts function. You will need to run the following code once on each R session:
# device argument also supports "pdf" and "postscript"
loadfonts(device = "win", quiet = TRUE)
Now you will be able to specify the fonts on the corresponding argument of the graphical function you are going to use with the name appearing on the fonts() list that corresponds to the font you want to set.
# Specify the font family with the name displayed on the fonts() output
plot(trees$Volume,
     main = "Custom fonts in base R",
     xlab = "",
     ylab = "Volume",
     pch = 21, col = 4, bg = 4,
     family = "Algerian") # We are setting the "Algerian" font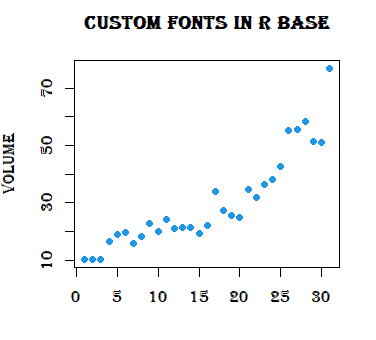
The same will apply for a ggplot2 chart:
# install.packages("ggplot2")
library(ggplot2)

ggplot(trees, aes(1:length(Volume), Volume)) +
      ggtitle("Custom fonts in ggplot2") +
      geom_point(col = 4) +
      xlab("") +
      theme(text = element_text(family = "Algerian")) # Custom font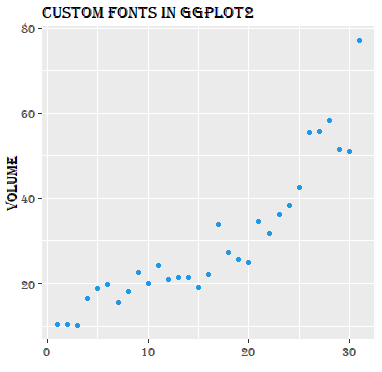
However, for some functions like the boxplot or hist you can’t specify the family argument. In this scenario there are two options:
On the one hand you can create the plot without texts and add them after with the title function as follows:
hist(trees$Height,
     main = "", xlab = "", ylab = "", # Empty texts
     col = 4)

# Add the title and Y-axis label
title("Height", family = "Algerian", cex.main = 2)
title(ylab = "Frequency", family = "Algerian", cex.lab = 1)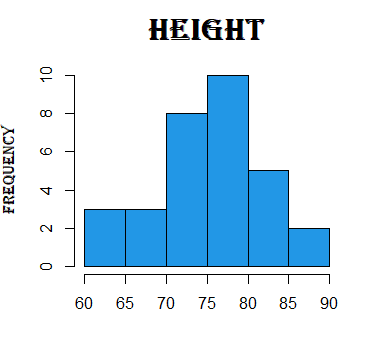
On the other hand, you can modify the graphical parameters setting the family argument of the par function. Note that this approach will modify the font of all texts, even the numbers.
# Save the current graphical parameters
op <- par(no.readonly = TRUE)

# Set the font globally
par(family = "Algerian") # Specify the name of the font

# Create the histogram
hist(trees$Height,
     main = "All Fonts",
     ylab = "Frequency",
     xlab = "",
     col = 4)

# Restore the graphical parameters
on.exit(par(op))
# dev.off()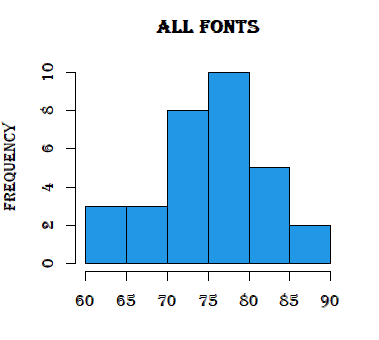
Load the extrafont package and run the loadfonts function in your R session before loading any other package to avoid issues.
The showtext package
The showtext package was created to be a simpler solution (avoiding the use of external softwares) with an easier way to add custom fonts in R graphs. This package works with several types of fonts like TrueType (.ttf), OpenType (.otf), Type 1, web fonts and more, while the previous only works for .ttf.
Adding a Google Font
Google Fonts can be added with the font_add_google function of the package. For instance, if you want to add the Pacifico font you can type:
# install.packages("showtext")
library(showtext)

# You will need to have internet connection
# If you restart R you will need to execute this code again to use the font
font_add_google(name = "Pacifico",   # Name of the font on the Google Fonts site
                family = "pacifico") # Name you want to use to call the font
In the name argument you will need to specify the name of the font displayed on the Google Fonts site. The string specified on the family argument will be the one you will need to set when specifying the font.
You can call the font_add_google functions as many times as fonts you want to load. The same applies to the font_add, which we will review on the following section.
Loading a custom font
If you want to add custom fonts in R you may have downloaded from any source, you will need to use the font_add function instead. In order to load a custom font for the first time you will need to follow this steps:
- Download the desired font.
-
Go to the file (
.otf,.ttf, …) and install it (right click – Install for all users). -
Run
font_paths()and go to the output path (it should beC:\\Windows\\Fontson Windows). - Find the font file you have installed. Right click – Properties and copy the text appearing on the top of the ‘General’ tab.
-
Choose a family name with the
familyargument and paste the text you copied before on theregularargument (appending the font extension) of thefont_addfunction.
The next times you just need to use the font_add function (Step 5).
As an example, we are going to install the Demo Muthiara font. Download it, follow the previous steps and add it.
# install.packages("showtext")
library(showtext)

# Check the fonts path of your system
font_paths() # "C:\Windows\Fonts"

# Add a custom font. You will need to run this code every time you restart R
font_add(family = "muthiara", # Name you want to use
         regular = "Muthiara-demo-version.otf") # Text of the 'General' tab plus the font extension
The font_add function also have the bold, italic, bolditalic and symbol arguments in case you want to add different styles of the fonts you are loading (if they are available for the font).
Using the custom fonts
Once you have loaded the fonts you want, there are three main ways of using them with the R showtext package:
First, If you want to set a font for all the graphical devices you are going to create you just need to call the showtext_auto function and specify the font on the corresponding argument of the function you are using. As an example, after loading the desired fonts you can specify the font family you loaded from Google Fonts as follows:
# Recall to load the Pacifico font as shown in the previous sections
#-------------------------------------------------------------------

# Load the fonts for all graphic devices
showtext_auto()

plot(trees$Volume,
     family = "pacifico",    # Font family. Recall we named it "pacifico"
     main = "Trees volume",
     ylab = "Volume", xlab = "",
     pch = 21, col = 4, bg = 4)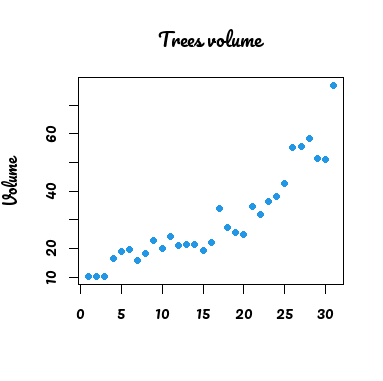
However, other functions (like boxplot or hist) will require you to set the texts individually as follows:
# Recall to load the Pacifico font as shown in the previous sections
#-------------------------------------------------------------------

# Load the fonts for all graphic devices
showtext_auto()

boxplot(trees$Volume,
        main = "", xlab = "", ylab = "", # Empty texts
        ylim = c(10, 90),
        col = 4)

# Add the title, Y-axis label and text with the custom font
title("Trees volume", family = "pacifico", cex.main = 2)
title(ylab = "Volume", family = "pacifico", cex.lab = 1)
text(x = 0.8, y = 78, "Outlier", family = "pacifico", cex = 1.2)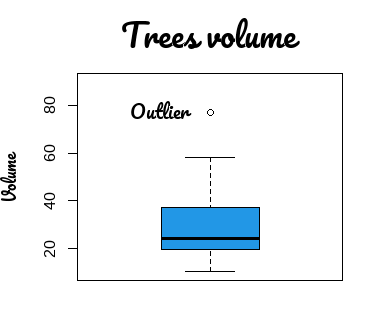
An alternative for these functions is to set the font family with the par function, but you will need to register the font with the windowsFonts and windowsFont functions, where you will need to pass the one corresponding string of the output of the fonts function of the extrafonts package. Go to the previous section if the font you want to add does not appear on the output list of that function.
This will modify all the texts at the same time. Nonetheless, this approach will only work for Windows Fonts, so we will use the Muthiara font on this example, but you can also download a Google Font and install it in your computer.
# Save the current graphical parameters
op <- par(no.readonly = TRUE)

# Register the font. The string will be the corresponding of the output of extrafont::fonts()
# In our case: extrafont::fonts()[245] will output "Muthiara -Demo Version-"
windowsFonts(muthiara = windowsFont("Muthiara -Demo Version-"))

# Set the font globally
par(family = "muthiara") # Specify the name of the variable you set on windowsFonts function

# Create the plot
boxplot(trees$Volume,
        main = "All   Fonts",
        ylab = "Volume",
        ylim = c(10, 90),
        col = 4)
text(x = 0.8, y = 78, "Outlier", cex = 1.2)

# Restore the graphical parameters
on.exit(par(op))
# dev.off()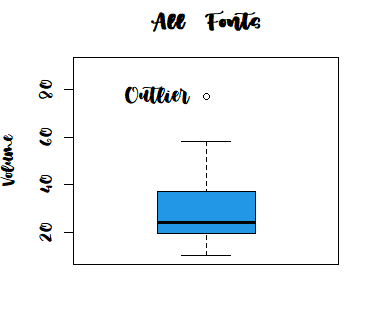
Similarly, you can do the same for a ggplot2 graph:
# Recall to load the Pacifico font as shown in the previous sections
#-------------------------------------------------------------------

# install.packages("ggplot2")
library(ggplot2)

# Load the fonts for all graphic devices
showtext_auto()

# Boxplot
ggplot(data = trees, aes(x = "", y = Volume)) +
       stat_boxplot(geom = "errorbar",
                    width = 0.2) +
       geom_boxplot(fill = 4,
                    outlier.colour = 1) +
       ggtitle("Trees volume") +
       annotate("text", x= 0.8, y = 78, label = "Outlier",
                family = "pacifico") +  # Font family of the annotation
       xlab("") +
       theme(text = element_text(family = "pacifico")) # Font family for the rest of the texts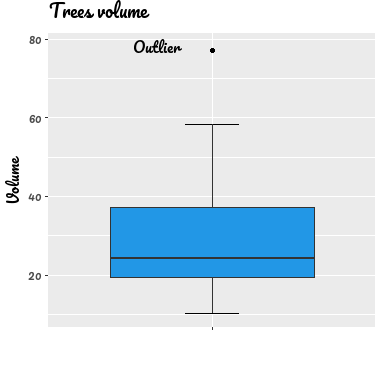
Second, if you want to use the custom fonts in some devices you will need to wrap your graph codes between showtext_auto() and showtext_auto(FALSE), which will use showtext automatically for future devices and turn it off, respectively. This is the recommended workflow. In the following block of code you can see an example with the calendR package.
# Recall to load the Muthiara font as shown in the previous sections
#-------------------------------------------------------------------

showtext_auto()

# -------- Graphs --------------
# install.packages(calendR)
library(calendR)

calendR(year = 2022, mbg.col = 4,
        start = "M",
        weeknames = c("M", "T", "W", "T", "F", "S", "S"),
        months.col = "white",
        special.days = "weekend",
        special.col = "lightblue",
        lty = 0,
        title.size = 60,
        orientation = "p",
        font.family = "muthiara") # Specify the font we loaded before

# -------- End graphs ----------

showtext_auto(FALSE)

# showtext won't work if you don't call showtext_auto() again
The last option is to use showtext for only a specific part of the code on the same device. For that purpose you can use the showtext_begin and showtext_end functions.
# Recall to load the Pacifico font as shown in the previous sections
#-------------------------------------------------------------------

boxplot(trees$Volume,
        main = "",
        xlab = "",
        ylab = "Volume",
        ylim = c(10, 90),
        col = 4)

# You won't be able to use the "pacifico" font outside these functions
showtext_begin()
title("Trees volume", family = "pacifico", cex.main = 2)
showtext_end()

# The following will print a warning message and the default font will be used:
text(x = 0.8, y = 78, "Outlier", family = "pacifico", cex = 1.2)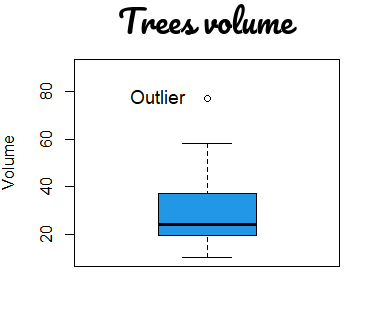
The RStudio compatibility of the package starts on version 0.9. If you call showtext_auto all should work as expected.