Calendar plot in R using ggplot2
The calendR package allows creating fully customizable ggplot2 calendar plots with a single function. In addition, the package provides arguments to create calendar heatmaps. In this tutorial you will learn how to create ready to print yearly and monthly calendar plots in R.
Yearly calendar plot in R
The package is very straightforward to use, as it only contains a function named the same way as the package, calendR. By default, if no argument is specified, the function will create the calendar of the current year in landscape and all the texts will be in the language of your system.
# install.packages("calendR")

library(calendR)

calendR() # Defaults to current year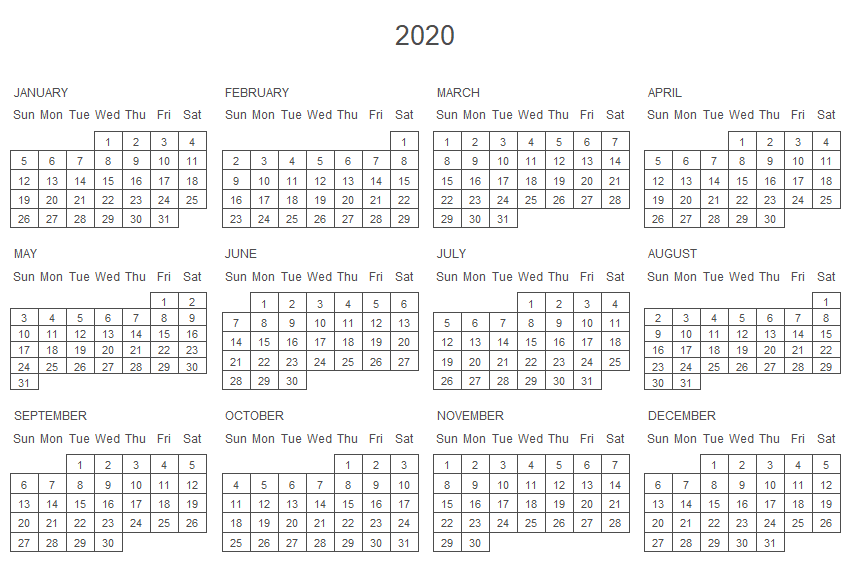
If you don’t want the calendar to be on the language of your operating system, you can modify it. As an example, if you want the calendars to be on Spanish you can type: Sys.setlocale("LC_ALL", "Spanish") before executing the calendR function.
If you prefer to create a yearly calendar plot of other year you can specify it on the year argument as follows:
calendR(year = 2021) # Specify the year you prefer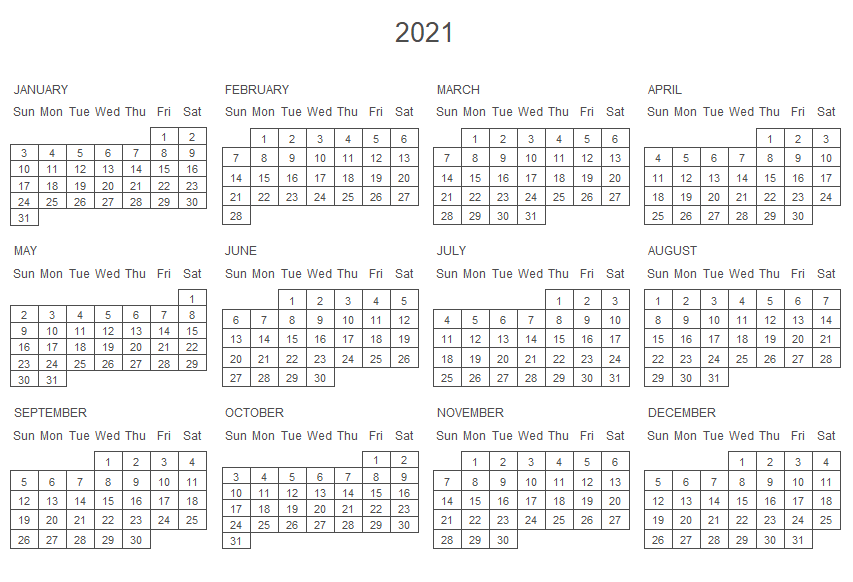
In the following subsections we are going to discuss how to start the weeks on Sunday or Monday and how to add a color to some days.
Note that the described features are also available for monthly calendars, but we will only explain them in this section to avoid repeating the same twice.
Start of the calendar weeks
Weeks of the calendars will start on Sunday by default. If you prefer, you can set the argument start as "M" to obtain a calendar plot where the week starts on Monday instead of on Sunday.
calendR(year = 2021,
        start = "M") # Start the week on Monday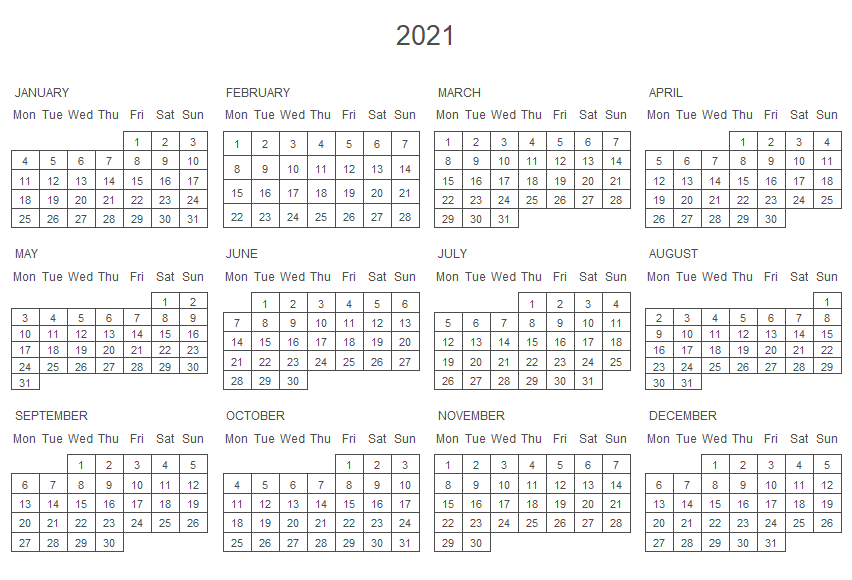
Adding colors to the days
The special.days argument will add color to the specified days inside a numeric vector. The color will be the one set on the special.col argument. Note that you have to specify the corresponding day of the year (from 1 to 365 or 366).
calendR(year = 2025,
        start = "M",
        special.days = c(9, 19, 56, 79, 102,  # Days to color
                         126, 257, 300, 342),
        special.col = "lightblue",            # Color of the specified days
        low.col = "white")                    # Background color of the rest of the days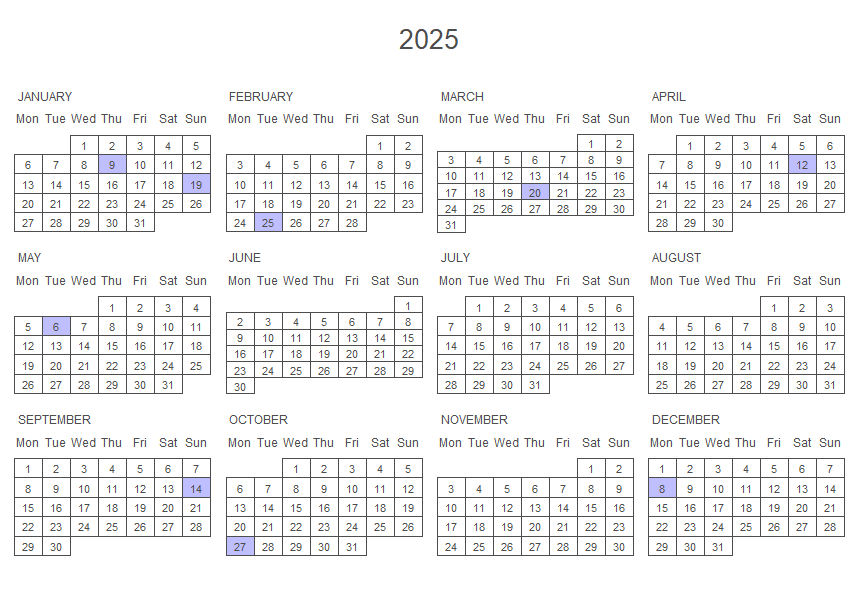
If you want to highlight all the weekends in your calendars, you can set the special.days argument to "weekend". This shortcut will color them all at once.
calendR(year = 2025,
        start = "M",
        special.days = "weekend") # Color all weekends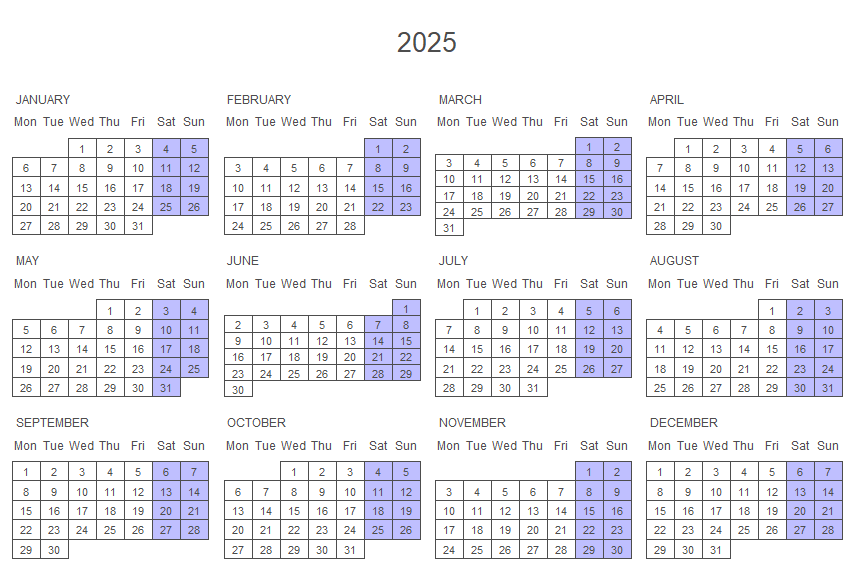
In order to add several events you will need to create a vector of NA values of the same length of the number of days of the corresponding year. Then, you can add the events to the corresponding days of the year on the vector, which you will need to specify inside the special.days argument. Note that you will need to specify as many colors as events.
# Vector of NA of the same length of the number of days of the year
events <- rep(NA, 365)

# Set the corresponding events
events[40:45] <- "Trip"
events[213:240] <- "Holidays"
events[252] <- "Birthday"
events[359] <- "Christmas"

# Creating the calendar with a legend
calendR(year = 2025,
        special.days = events,
        special.col = c("pink", "lightblue", # Colors
                        "lightgreen", "lightsalmon"),
        legend.pos = "right") # Legend to the right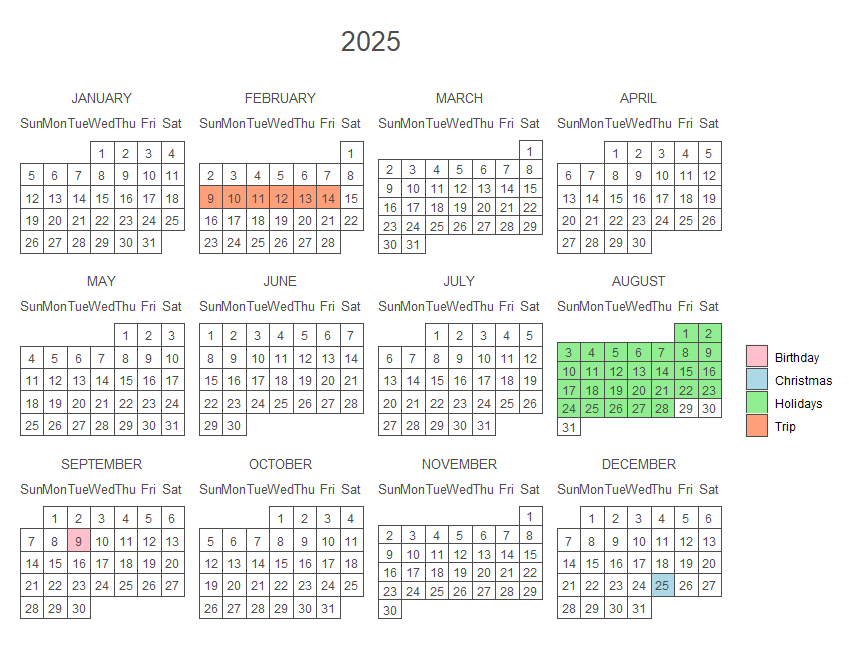
Vertical yearly calendar
It is worth to mention that you can also create yearly calendars in R in portrait mode. For that purpose, you will need to set the argument orientation as "portrait" or as "p". This configuration will lead to a three column calendar.
calendR(orientation = "portrait", # Equivalent to: orientation = "p"
        months.pos = 0)           # Month names aligned to the left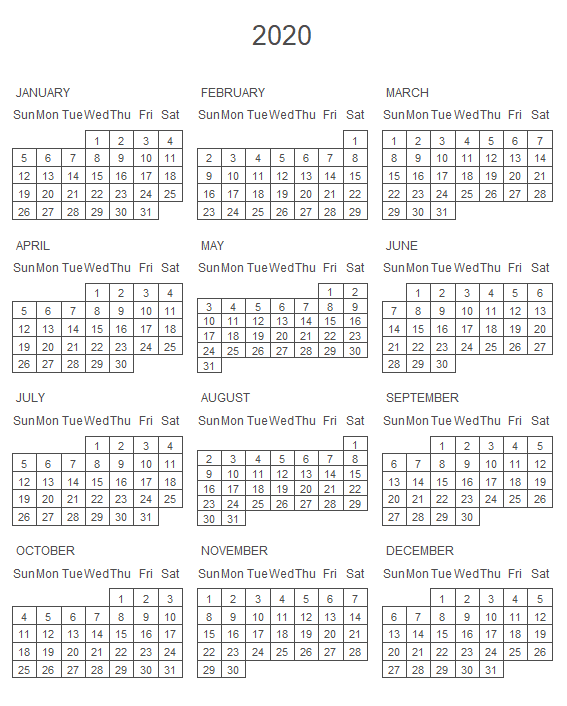
Monthly calendar plot in R
The previously described features of the yearly calendar are also available for monthly calendars. Nonetheless, monthly calendars also allows you to add text to the days of the month if desired.
In order to create a monthly calendar you will need to specify both the year and the month as follows:
calendR(year = 2021, month = 8)
Adding colors to the days
As we discussed in the previous section, you can add color of the days specified in the special.days argument.
On the one hand, for only one event the colored days will be the ones specified on the special.days argument and the color will be the one chosen with the special.col argument. You can also specify special.days = "weekend" to color all the weekends.
calendR(year = 2021, month = 8,
        special.days = c(1, 9, 12, 23, 28),
        special.col = "#bfe2f2",
        low.col = "white")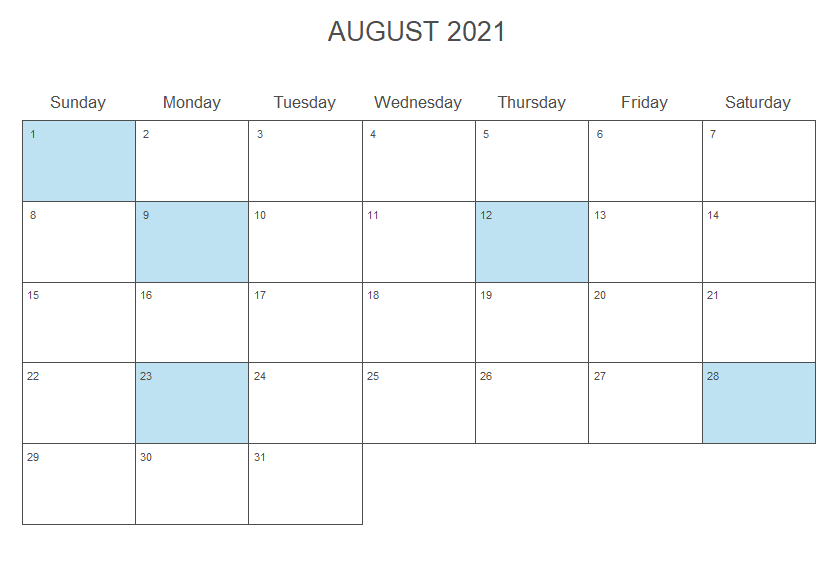
On the other hand, to add more than one event to the R calendar you will need to create a vector of NA values of the same length of the number of days of the corresponding month and set the events on the corresponding days. In the following example we show how to add several events, weekends included and how to add a legend.
# Vector of dates
dates <- seq(as.Date("2020-08-01"), as.Date("2020-08-31"), by = "1 day")

# Vector of NA and weekends
# (with the week starting on Monday)
events <- ifelse(format(dates, "%w") %in% c(5, 6), "Weekend", NA)

# Adding more events
events[c(3, 5, 10, 12, 17, 19, 24, 26)] <- "Academy"
events[c(13, 27)] <- "Swimming"
events[30] <- "Exam"

# Creating the calendar
calendR(year = 2021, month = 8,
        start = "M",
        special.days = events,
        special.col = c("lightgreen", "pink",  # As many colors
                        "#f7f7f7", "#bfe2f2"), # as events
        low.col = "white",
        legend.pos = "bottom", # Legend position
        legend.title = "")     # Legend title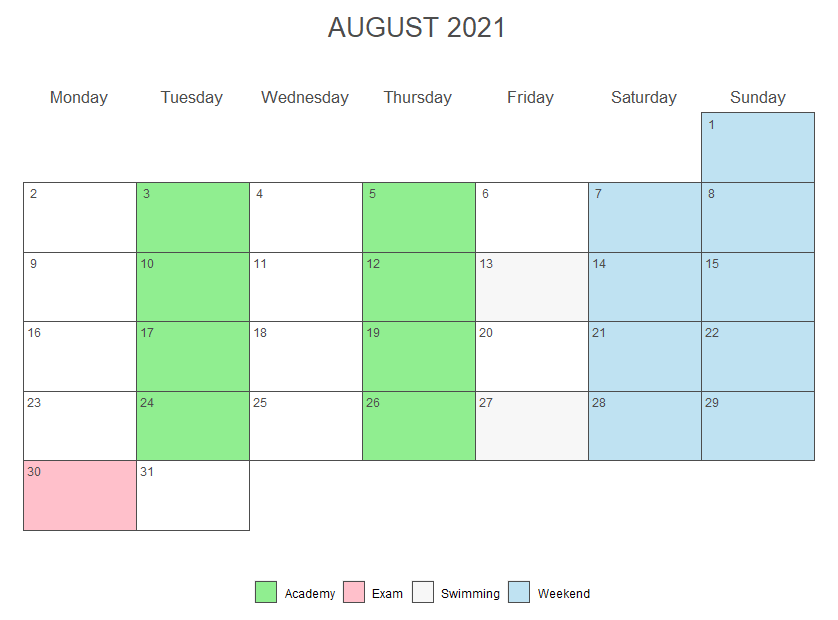
Adding text to the days
When working with monthly calendar plots you can also add some text to the days with the text argument and specify its position (the days) with the text.pos argument. Note that you can modify the size and color of the texts with the text.size and text.col arguments, respectively.
calendR(year = 2021, month = 8,        # Year and month
        start = "M",                   # Start the week on Monday
        text = c("Running", "Running", # Add text (only for monthly calendars)
                 "Class"),
        text.pos = c(5, 16, 25),       # Days of the month where to put the texts
        text.size = 4.5,               # Font size of the text
        text.col = 4)                  # Color of the texts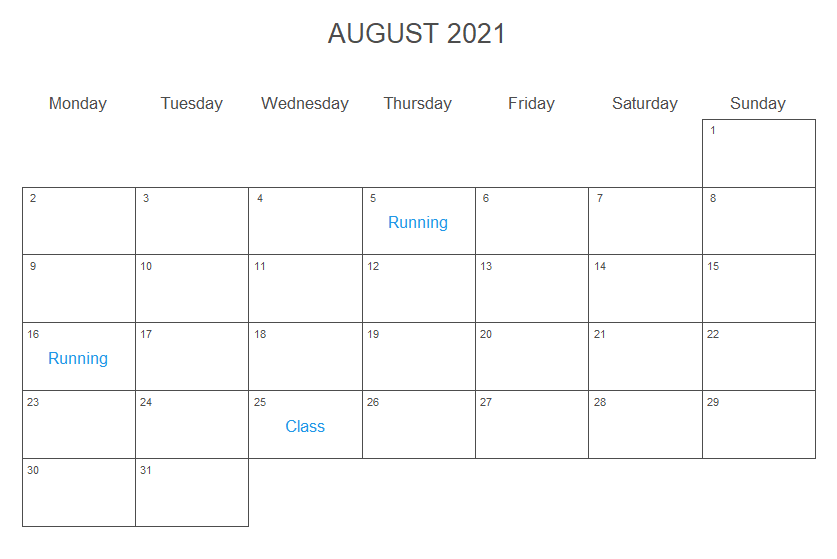
Note that you can add more text to the same day separating the texts with "\n". Eg: text = "Running\nSwimming".
Lunar calendar in ggplot2
If you create a monthly calendar you can also add the moon phases to its days. To do this set lunar = TRUE and modify the size of the moons with the lunar.size argument. You can also change the color of the hidden area of the moons with the lunar.col argument.
calendR(month = 2,
        lunar = TRUE,         # Add moons to the calendar
        lunar.col = "gray60", # Color of the non-visible area of the moons
        lunar.size = 7)       # Size of the moons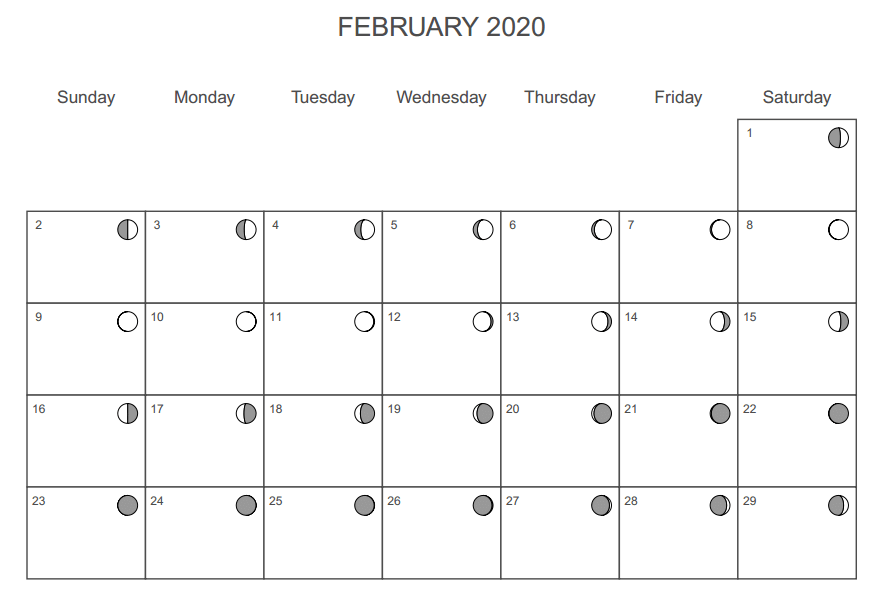
Custom start and end date
If instead of setting the year and month arguments you set start_date and end_date. These calendars have the same functionalities than yearly calendars, despite you specify only one month.
calendR(start_date = "2023-10-01", # Custom start date
        end_date = "2024-05-31")   # Custom end date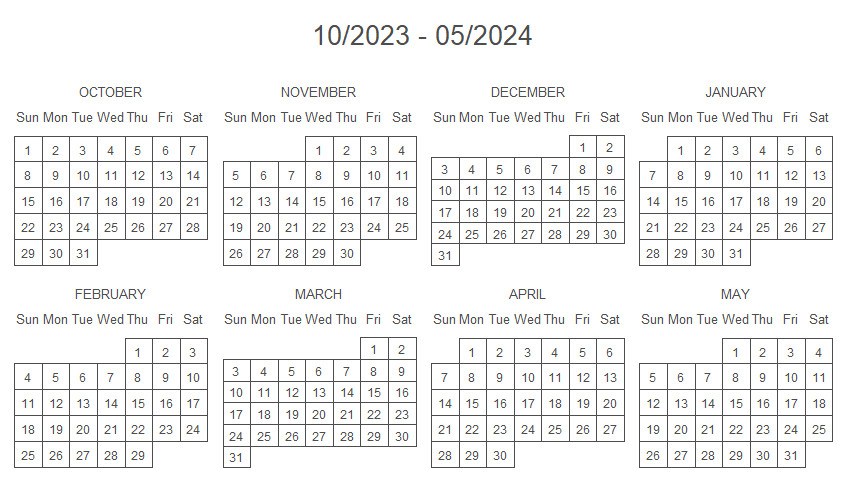
Academic calendar
The start_date and end_date arguments are specially useful for creating academic calendars. See an example below:
calendR(start_date = "2020-09-01", # Custom start date
        end_date = "2021-05-31",   # Custom end date
        start = "M",               # Start the weeks on Monday
        mbg.col = 4,               # Color of the background of the names of the months
        months.col = "white",      # Color text of the names of the months
        special.days = "weekend",  # Color the weekends
        special.col = "lightblue", # Color of the special.days
        lty = 0,                   # Line type
        bg.col = "#f4f4f4",        # Background color
        title = "Academic calendar 2020-2021", # Title
        title.size = 30,                       # Title size
        orientation = "p")         # Vertical orientation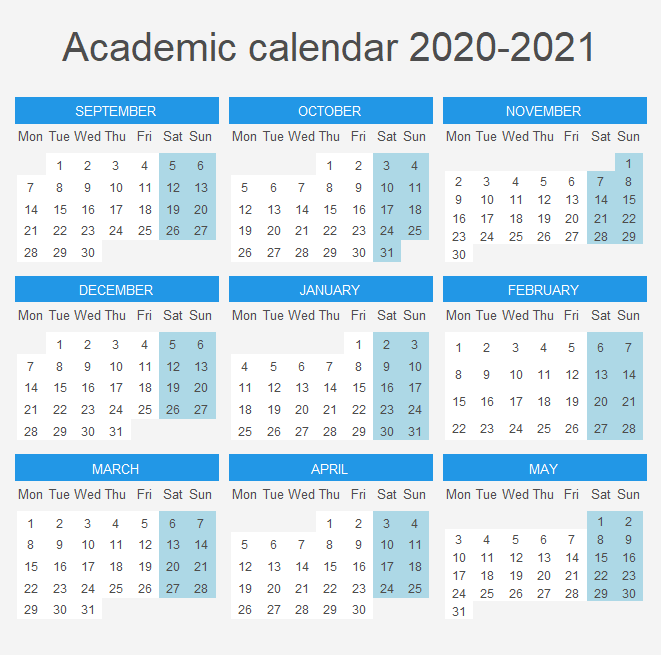
Calendar heatmap in R
In addition, the function of the calendR package allows creating calendar heatmaps, setting the argument gradient as TRUE and specifying a vector of the length of the number of days of the corresponding year or month in the special.days argument.
It is worth to mention that the color specified in the special.col will be used as the higher color of the gradient, while the lower will be set with the low.col argument, which defaults to "white".
calendR(year = 2021,
        special.days = 1:365, # Vector of the same length as the number of days of the year
        gradient = TRUE,      # Set gradient = TRUE to create the heatmap
        special.col = rgb(1, 0, 0, alpha = 0.6), # Color of the gradient for the highest value
        low.col = "white")                       # Color of the gradient for the lowest value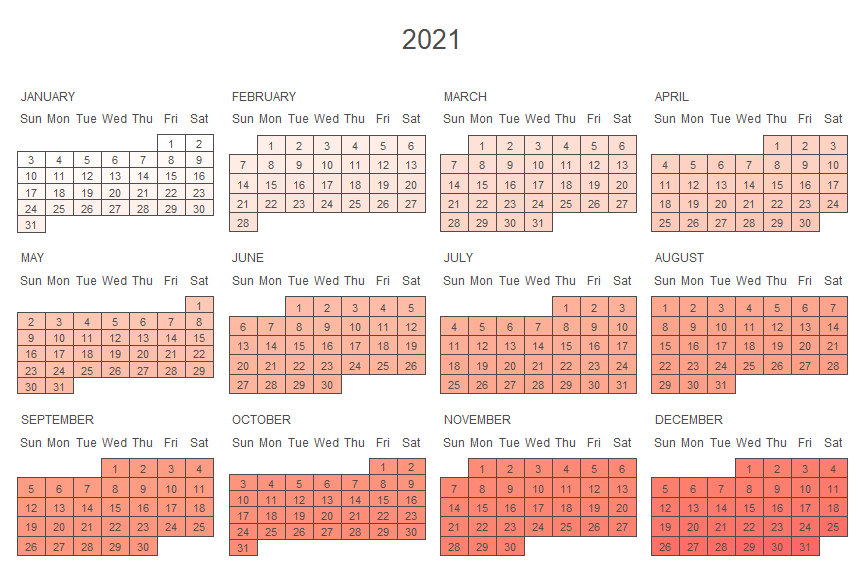
You can do the same with a monthly calendar:
set.seed(2)

calendR(year = 2020,
        month = 5,
        special.days = rnorm(31),  # Vector of the same length as the number of days of the month
        gradient = TRUE,           # Set gradient = TRUE to create the heatmap
        special.col = "lightblue", # Color of the gradient for the highest value
        low.col = "white")         # Color of the gradient for the lowest value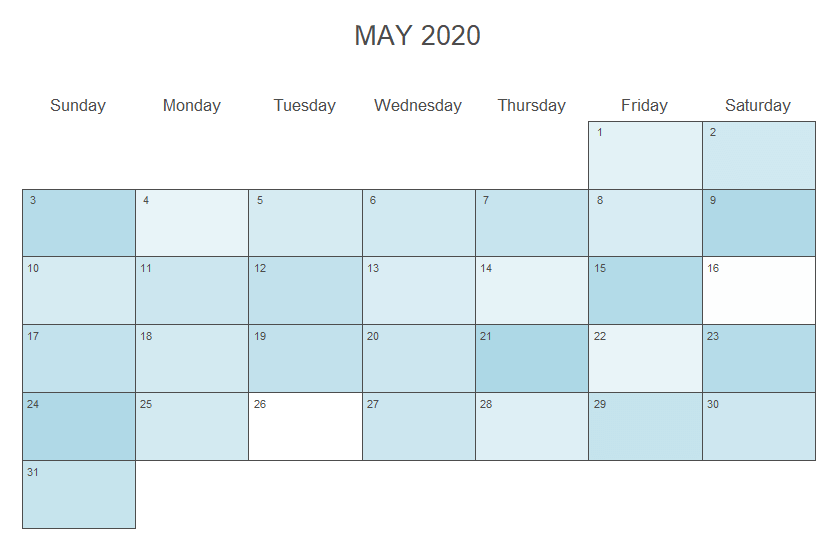
Moreover, you can add a legend to yearly and monthly calendar heatmaps in R setting the position of the legend with the legend.pos argument. Note that you can also specify a legend title with the legend.title argument.
set.seed(2)

calendR(year = 2021,
        month = 6,
        special.days = rnorm(30),
        gradient = TRUE,
        special.col = "lightblue",
        legend.pos = "right",     # Position of the legend
        legend.title = "Legend")  # Title of the legend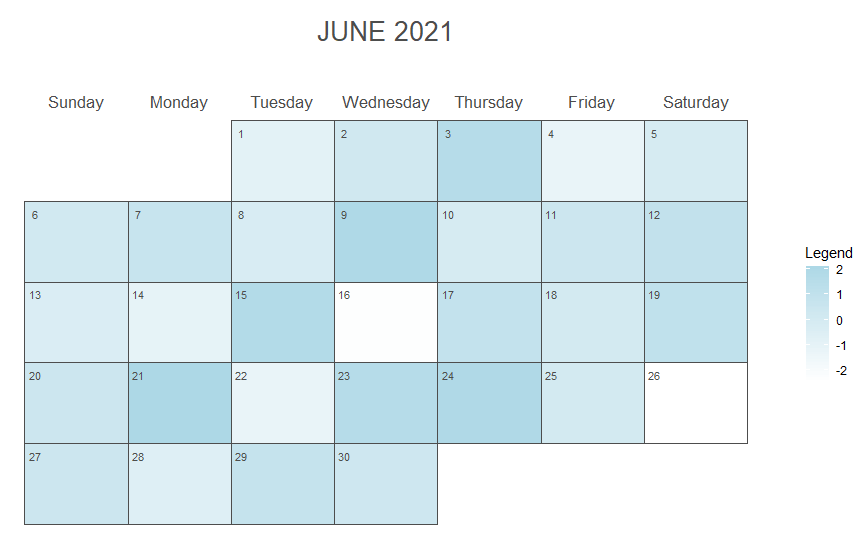
Further customization of the calendar plots
There are a wide variety of arguments that you can modify to customize the resulting output. In this section we are going to show some custom examples to learn to customize each argument. In the following block of code you can see a simple example:
calendR(year = 2020,                      # Year
        month = 10,                       # Month
        start = "S",                      # Start of the week ("S": Sunday, "M": Monday)
        title = "My calendar",            # Change the title
        title.size = 30,                  # Font size of the title
        title.col = 2,                    # Color of the title
        subtitle = "Have annice day",    # Add a subtitle
        subtitle.col = 3,                 # Color of the subtitle
        weeknames = c("S", "M", "T", "W", # Change week day names
                      "T", "F", "S"),
        special.days = "weekend",         # Colorize the weekends (you can also set a vector of days)
        special.col = rgb(0, 0, 1, 0.15), # Color of the special days
        col = "#f2f2f2",                  # Color of the lines of the calendar
        lwd = 1,                          # Width of the lines of the calendar
        lty = 1,                          # Line type of the lines of the calendar
        font.family = "mono",             # Font family of all the texts
        font.style = "bold",              # Font style of the texts except the subtitle
        weeknames.col = "gray30",          # Color of the names of the days of the week
        months.col = "gray30",             # If month = NULL, is the color of the month names
        days.col = 4,                     # Color of the number of the days
        day.size = 3.5,                   # Size of the number of days
        bg.img = "")                      # Background image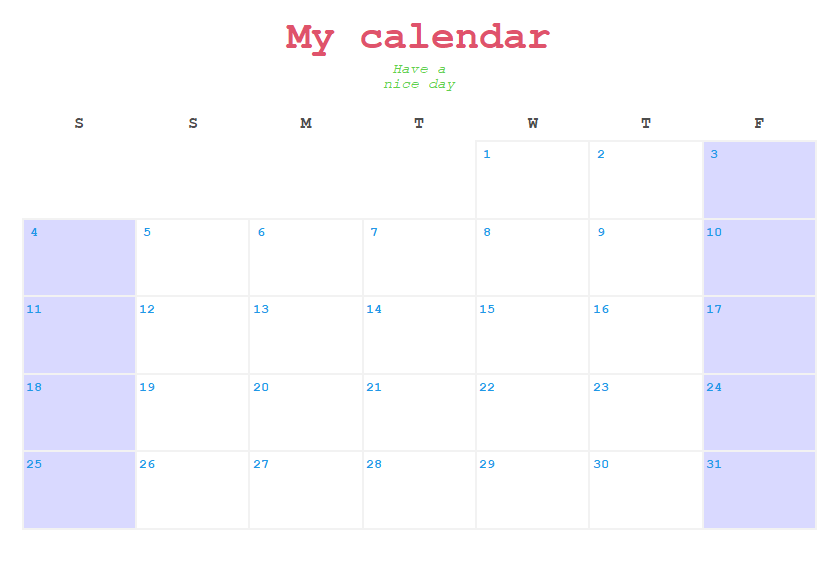
Next we create another calendar, with dark colors:
calendR(month = 10,  # Month
        start = "M", # Week starts on Monday
        orientation = "landscape", # Horizontal

        # Size and color of the title
        title.size = 40,
        title.col = "white",

        # Subtitle, color y and size
	    subtitle = "Trick or Treat",
        subtitle.col = "white",
        subtitle.size = 16,

        # Text, color, size and position
        text = "Halloween",
	    text.col = "red",
        text.size = 5,
        text.pos = 31,

        # Color the weekends with gray
        special.days = "weekend",
        special.col = "grey40",

        # Color of the lines, of the background
        # and of the days
        col = "white",
        bg.col = "grey20",
        low.col = "transparent", # The same color as the background

        # Color and size of the number of the days
        days.col = "white",
        day.size = 4,

        # Moon phases and moon sizes
        lunar = TRUE,
	    lunar.size = 8,

        # Color and size of the week names
        weeknames.col = "white",
        weeknames.size = 6,

        # Width and line types
        lwd = 0.25,
        lty = 1,

        # Font family and font styles
	    font.family = "sans",
        font.style = "plain")
Last, we are going to create a calendar in R with a background image:
# Background image (link or source file)
# If the image is from a local source it must be on the working directory,
# in other case you must indicate the full path
img <- "https://i.pinimg.com/originals/10/1e/f6/101ef6a9e146b23de28fa2cd568ad17b.jpg"

calendR(start = "M",               # Weeks start on Monday
        mbg.col = 4,               # Background color of the month names
        months.col = "white",      # Color of the text of the month names
        special.days = "weekend",  # Color the weekends
        special.col = "lightblue", # Color of the special.days
        lty = 0,                   # Line type (no line)
        weeknames = c("Mo", "Tu",  # Week names
                      "We", "Th",
                      "Fr", "Sa",
                      "Su"),
        title.size = 40,   # Title size
        orientation = "p", # Vertical orientation
        bg.img = img)      # Background image
Saving the calendar as PDF format
Finally, you can set the argument pdf to TRUE to save the calendars in a ready to print PDF format (A4 format by default).
You can also specify the name of the generated PDF file in the doc_name argument, but if not specified, the name of the file will be of the format: Calendar_year.pdf for yearly calendars or Calendar_month_year.pdf for monthly calendars. As an example, you can save a four column yearly calendar plot in R with the following code:
calendR(year = 2021,
        orientation = "landscape", # Set orientation = "portrait" for a three column calendar
        pdf = TRUE,
        doc_name = "My_calendar")  # Name of the PDF (don't write the extension)
Moreover, you can choose between several paper sizes to save the calendar, from "A6" to "A0" but note you may need to fine tune some font sizes to get the desired output.
calendR(year = 2021,
        orientation = "landscape",
        pdf = TRUE,
        papersize = "A6") # Choose the paper size
Note that if you set "portrait" orientation for a monthly calendar, the calendar will be displayed the same as "landscape" on the plot window but it will be saved vertically on the PDF.
calendR(year = 2021,
        month = 1,
        orientation = "portrait",
pdf = TRUE)![]()