Add legend to a plot in R
A legend of a plot helps to understand which series or groups corresponds to each bar, line, box or observations, based on its type, color or both. In this tutorial you will learn how to add a legend to a plot in base R and how to customize it.
The R legend() function
The legend function allows you to add a legend to a plot in base R. The summarized syntax of the function with the most common arguments is described in the following block:
legend(x, y,   # Coordinates (x also accepts keywords)
       legend, # Vector with the name of each group
       fill,   # Creates boxes in the legend with the specified colors
       col = par("col"), # Color of lines or symbols
       border = "black", # Fill box border color
       lty, lwd,         # Line type and width
       pch,              # Add pch symbols to legend lines or boxes
       bty = "o",        # Box type (bty = "n" removes the box)
       bg = par("bg")    # Background color of the legend
       box.lwd = par("lwd"), # Legend box line width
       box.lty = par("lty"), # Legend box line type
       box.col = par("fg"),  # Legend box line color
       cex = 1,          # Legend size
       horiz = FALSE     # Horizontal (TRUE) or vertical (FALSE) legend
       title = NULL      # Legend title
)
Recall that there are even more arguments you can use, but we listed the most common, so type args(legend), ?legend or help(legend) for additional information.
In the following sections we will explain how to customize the most common arguments of the function. In order to avoid repeating code we will use the following function to plot two Bessel functions in R (\(J_0\) and \(J_2(x)\)):
plotl <- function(...) {
    x <- seq(0, 30, 0.01)
    plot(besselJ(x, 0), col = 2, type = "l",
         lwd = 2, ylab = "Jn(x)", xlab = "", ...)
    lines(besselJ(x, 2), col = 3, type = "l", lwd = 2, lty = 2)
}

plotl()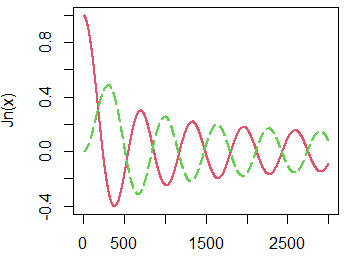
The plots of this article have been created with a window of width and height of 4 inches (10.16 cm): windows(4, 4), unless otherwise is indicated. In case of using other sizes you may need to fine-tune some arguments to get the same outputs.
R legend position, lines and fill
When adding a legend to a plot, there are two main ways to modify the legend position with the R legend function.
On the one hand, you can set the argument x to "top", "topleft", "topright", "bottom", "bottomleft", "bottomright", "left", "right" or "center". In this scenario you don’t have to set the argument y.
plotl()
legend(x = "topright",          # Position
       legend = c("J0", "J2"),  # Legend texts
       lty = c(1, 2),           # Line types
       col = c(2, 3),           # Line colors
       lwd = 2)                 # Line width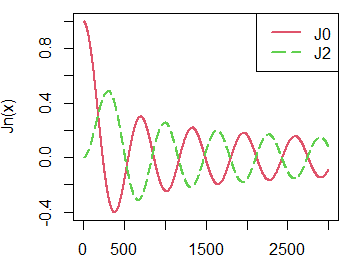
On the other hand, you can use the arguments x and y as coordinates to indicate where to draw the legend.
plotl()
legend(x = 1900, y = 0.8, # Coordinates
       legend = c("J0", "J2"),
       lty = c(1, 2),
       col = c(2, 3),
       lwd = 2)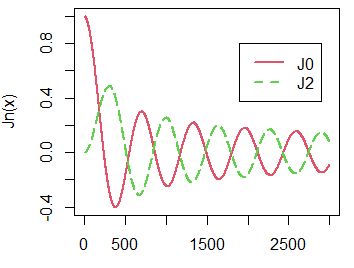
However, you can also modify the distance from the margin, in case that you don’t want the legend to be in the margin, with the inset argument:
plotl()
legend("topright",   # Position
       inset = 0.05, # Distance from the margin as a fraction of the plot region
       legend = c("J0", "J2"),
       lty = c(1, 2),
       col = c(2, 3),
       lwd = 2)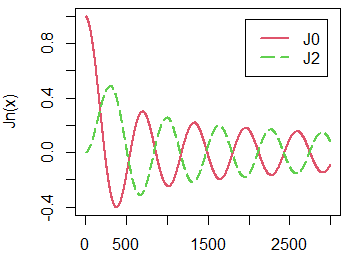
If the lines of the plot contain any symbols you can add them to the legend with the argument pch.
Note that if you need to add a legend to a bar plot, pie chart or box plot you can use the fill argument instead of setting lines.
barplot(table(mtcars$gear), col = 2:4)

legend("topright",
       legend = c(3, 4, 5),
       fill = 2:4,       # Color of the squares
       border = "black") # Color of the border of the squares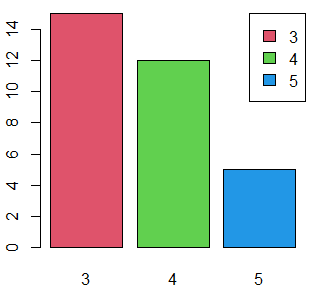
If your plot have shading lines you can also add them to the legend with the density argument and modify the angle on the lines with the angle argument of the function.
barplot(table(mtcars$gear), col = 2:4, density = 30, angle = 90)

legend("topright",
       legend = c(3, 4, 5),
       fill = 2:4,
       density = 30, # Shading lines density
       angle = 90)   # Angle of the shading lines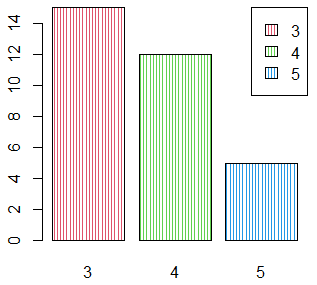
Legend title
In case you need to add a title to the legend, in order to add some description of the elements of the legend, you can use the title argument. Note that you can customize the color of the text with the title.col argument and that you can make a horizontal adjustment of the title with the title.adj argument.
plotl()
legend("topright", legend = c("J0", "J2"),
       title = "LEGEND TITLE",  # Title
       title.adj = 0.5,         # Horizontal adjustment of the title
       title.col = "blue",      # Color of the title
       lty = c(1, 2), col = c(2, 3), lwd = 2)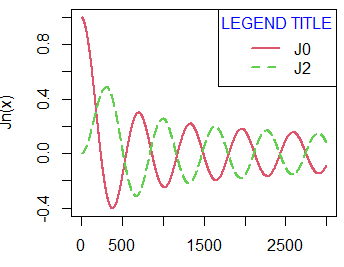
Note that the argument text.font allows you to modify the font of the texts of your legend.
Legend border and colors
By default, the legend is drawn inside a black rectangle. Nonetheless, you can change the type, width and color of the line of the rectangle with the box.lty, box.lwd and box.col arguments, respectively.
plotl()
legend(1500, 0.9,
       legend = c("J0", "J2"),
       box.lty = 2, # Line type of the box
       box.lwd = 2, # Width of the line of the box
       box.col = 4, # Color of the line of the box
       lty = c(1, 2),
       col = c(2, 3),
       lwd = 2)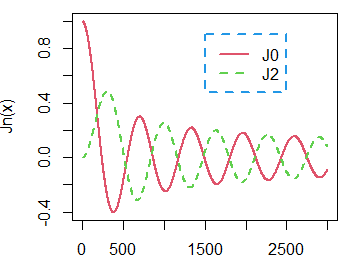
You can also disable the border of the box setting the argument bty as "n". Note that an alternative is to set box.lty = 0.
plotl()
legend(1500, 0.9,
       legend = c("J0", "J2"),
       bty = "n", # Removes the legend box
       lty = c(1, 2),
       col = c(2, 3),
       lwd = 2)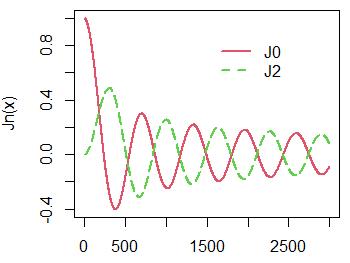
In addition, if byt is different to "n" you can set the background color of the legend box. Note that if you don’t want to show the line of the box you can set it to the background color of the plot or the background color of the box or just set box.lty = 0.
plotl()
legend("topright", inset = 0.05,
       legend = c("J0", "J2"),
       bg = rgb(1, 0, 0, alpha = 0.15), # Legend background color
       box.col = "white",
       lty = c(1, 2),
       col = c(2, 3),
       lwd = 2)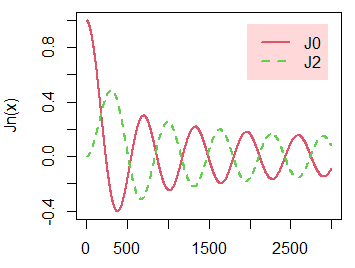
Change legend size
In order to change the legend size in R you can make use of the cex argument. Values bigger than 1 will lead to a bigger legend and smaller to smaller legends than the default.
plotl()
legend("topright",
       legend = c("J0", "J2"),
       lty = c(1, 2),
       col = c(2, 3),
       cex = 1.5, # Change legend size
       lwd = 2)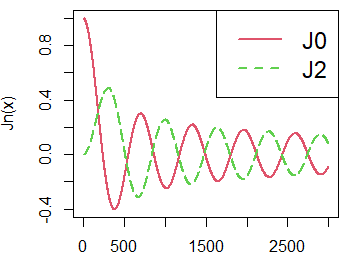
Legend outside plot
Sometimes, the representation covers all the area of the plot. In that case, it is a good idea to move the legend outside the plot. For that purpose, you will need to make use of the par function, to modify the margins of the plot, and the inset and xpd arguments as follows:
# Make the window wider than taller
windows(width = 4.5, height = 4)

# Save current graphical parameters
opar <- par(no.readonly = TRUE)

# Change the margins of the plot (the fourth is the right margin)
par(mar = c(5, 5, 4, 6))

plotl()
legend(x = "topright",
       inset = c(-0.45, 0), # You will need to fine-tune the first
                            # value depending on the windows size
       legend = c("J0", "J2"),
       lty = c(1, 2),
       col = c(2, 3),
       lwd = 2,
       xpd = TRUE) # You need to specify this graphical parameter to
                   # put the legend outside the plot

# Back to the default graphical parameters
on.exit(par(opar))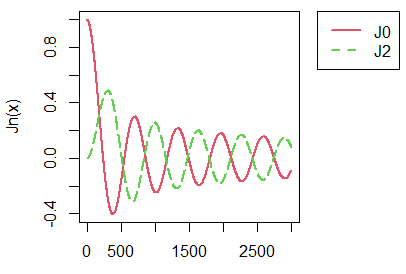
Recall that for plots of other sizes you will need to fine-tune the margins and the inset to obtain the correct plot.
An alternative is to put the legend under the plot. For that purpose you can set the margins, the inset argument and the position to the following:
windows(width = 4, height = 4)

# Save current graphical parameters
opar <- par(no.readonly = TRUE)

# Change the margins of the plot (the first is the bottom margin)
par(mar = c(6, 4.1, 4.1, 2.1))

plotl()
legend(x = "bottom",
       inset = c(0, -0.5), # You will need to fine-tune the second
                           # value depending on the windows size
       legend = c("J0", "J2"),
       lty = c(1, 2),
       col = c(2, 3),
       lwd = 2,
       xpd = TRUE, # You need to specify this graphical parameter to add
                   # the legend outside the plot area
       horiz = TRUE) # Horizontal legend. You can also set the number
                     # of columns with the argument ncol
                     # if horiz = FALSE

# Back to the default graphical parameters
on.exit(par(opar))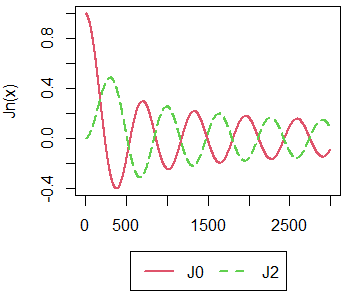
Add two legends in R
You can add two or more legends to a plot, just running the legend function multiple times with different arguments. In the following example we are going to add two more Bessel functions and add a new legend for them.
plotl()
lines(besselJ(seq(0, 30, 0.01), 3), col = 4, type = "l", lwd = 2, lty = 2)
lines(besselJ(seq(0, 30, 0.01), 4), col = 5, type = "l", lwd = 2, lty = 2)

legend("topright",
       legend = c("J0", "J2"),
       lty = c(1, 2), col = c(2, 3), lwd = 2)

legend("top",
       legend = c("J3", "J4"),
       lty = 2, col = c(4, 5), lwd = 2)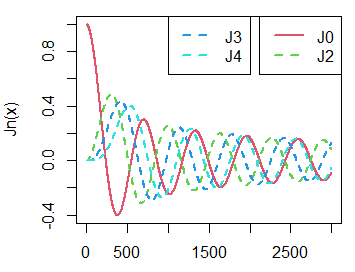
Note that you can also add more legends outside the plot, in case the legends doesn’t fit inside the layout.
# Make the window wider than taller
windows(width = 4.5, height = 4)

# Save the current graphic parameters
opar <- par(no.readonly = TRUE)
par(mar = c(5, 5, 4, 6))

# Create the plot
plotl()
lines(besselJ(seq(0, 30, 0.01), 3), col = 4, type = "l", lwd = 2, lty = 2)
lines(besselJ(seq(0, 30, 0.01), 4), col = 5, type = "l", lwd = 2, lty = 2)

# Add first legend
legend(x = "topright",
       inset = c(-0.45, 0),
       legend = c("J0", "J2"),
       lty = c(1, 5), col = c(2, 3),
       lwd = 2, xpd = TRUE
)

# Add second legend
legend(x = "right",
       inset = c(-0.45, 0),
       legend = c("J3", "J4"),
       lty = 2, col = c(4, 5),
       lwd = 2, xpd = TRUE
)

# Restore original graphical parameters
on.exit(par(opar))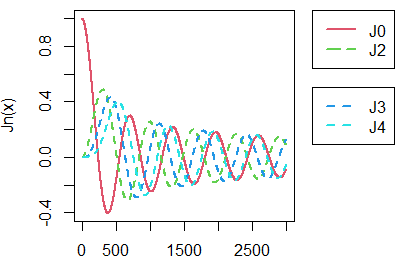
Plot legend labels on plot lines
You can also add legends to a plot labelling each line. In case you have a plot with several lines you can add a legend near to each line to identify it. For that purpose, you can make use of the legend function as many times as the number of lines:
plotl(xlim = c(0, 4000))

legend(2800, 0.05, legend = "J0", bty = "n")
legend(2800, 0.25, legend = "J2", bty = "n")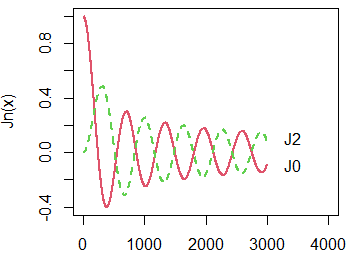
An alternative is to use the text function and specify the text and the position. E.g. text(3500, -0.075, "J0").
Add more info into legend
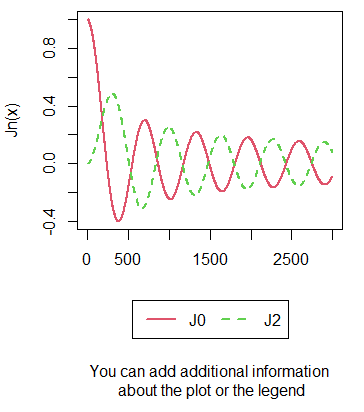
Finally, it is worth to mention that, if needed, you can add more information to a legend. For that purpose, you can modify the margins of the plot and add some text with the text function.
# Window taller than wider
windows(width = 4, height = 5.5)

# Save current graphical parameters
opar <- par(no.readonly = TRUE)

# Margins of the plot (the first is the bottom margin)
par(mar = c(12, 4.1, 4.1, 2.1))

# Plot
plotl()

# Legend under the plot
legend(x = "bottom",
       inset = c(0, -0.5), # You will need to fine-tune the
                           # first value depending on the windows size
       legend = c("J0", "J2"),
       lty = c(1, 2),
       col = c(2, 3),
       lwd = 2,
       xpd = TRUE,   # You need to specify this to add
                     # the legend to put the legend outside the plot
       horiz = TRUE) # Horizontal legend. You can also set the number
                     # of columns with the argument ncol if horiz = FALSE

# Adding additional information
par(xpd = TRUE)
text(1500, -1.5, "You can add additional informationn about the plot or legend")

# Back to the default graphical parameters
on.exit(par(opar))