Progress bar in R
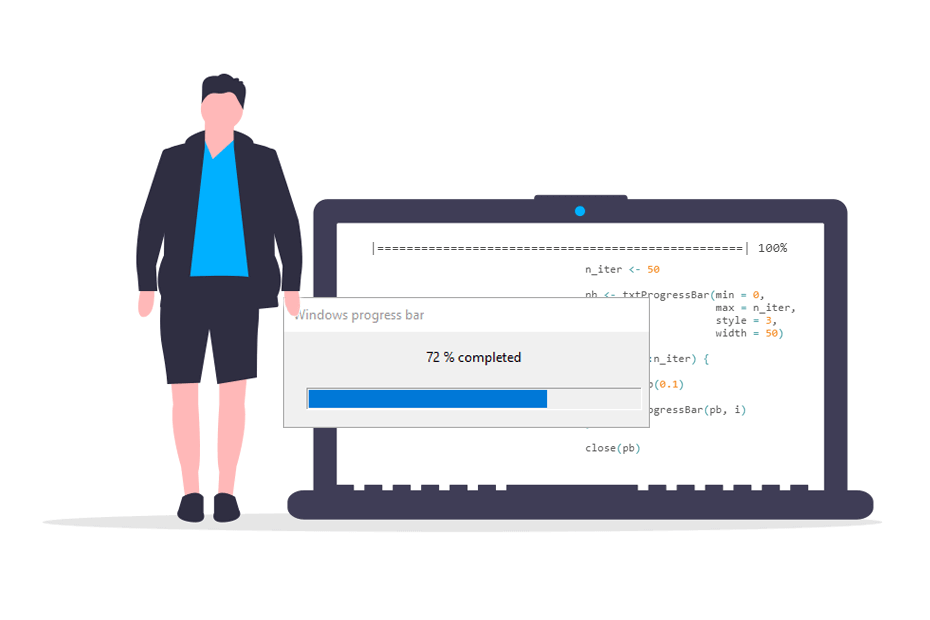
When running simulation studies that take a long time to finish, it is very useful to set a progress bar to check the completed percentage of the iterations. In this tutorial you will learn how to set a progress bar in R with different approaches to check the progress of for loops and apply functions.
Insert progress bar
The txtProgressBar function
The most common functions used to add a progress bar in R are the txtProgressBar and setTxtProgressBar functions from base R.
In the following block of code we show you how to set a progress bar inside a for loop, briefly describing the different arguments that you can customize.
n_iter <- 50 # Number of iterations of the loop

# Initializes the progress bar
pb <- txtProgressBar(min = 0,      # Minimum value of the progress bar
                     max = n_iter, # Maximum value of the progress bar
                     style = 3,    # Progress bar style (also available style = 1 and style = 2)
                     width = 50,   # Progress bar width. Defaults to getOption("width")
                     char = "=")   # Character used to create the bar

for(i in 1:n_iter) {

    #---------------------
    # Code to be executed
    #---------------------

    Sys.sleep(0.1) # Remove this line and add your code

    #---------------------

    # Sets the progress bar to the current state
    setTxtProgressBar(pb, i)
}

close(pb) # Close the connection
|==================================================| 100%>The Sys.sleep function is used for illustration purposes, so the loop takes a few seconds to run and the progress of the bar can be visualized. This function stops the execution each iteration for the specified time (in seconds).
Elapsed and estimated remaining time
The function only displays the current percentage of iterations that have been executed.
In order to provide further functionalities, we have developed an approach to display the elapsed time and an estimation of the remaining time, based on the mean time that the previous iterations took to run. Note that in order to display hours, minutes and seconds we have used the seconds_to_period function from the lubridate package.
# install.packages("lubridate")
library(lubridate)

n_iter <- 20

pb <- txtProgressBar(min = 0,
                     max = n_iter,
                     style = 3,
                     width = n_iter, # Needed to avoid multiple printings
                     char = "=")

init <- numeric(n_iter)
end <- numeric(n_iter)


for(i in 1:n_iter){

    init[i] <- Sys.time()

    #---------------------
    # Code to be executed
    #---------------------

    Sys.sleep(0.1) # Remove this line and add your code

    #---------------------

    end[i] <- Sys.time()

    setTxtProgressBar(pb, i)
    time <- round(seconds_to_period(sum(end - init)), 0)

    # Estimated remaining time based on the
    # mean time that took to run the previous iterations
    est <- n_iter * (mean(end[end != 0] - init[init != 0])) - time
    remainining <- round(seconds_to_period(est), 0)

    cat(paste(" // Execution time:", time,
              " // Estimated time remaining:", remainining), "")

}

close(pb)
|====================| 100% // Execution time: 2S // Estimated time remaining: 0S >If the values specified in the max and width arguments are shorter than the number of iterations, the cat function will print values multiple times.
Package ‘progress’
As an alternative to the previous functions you can use the progress package, which allows further customization.
There are several arguments that you can customize, so recall to type ?progress for additional details, but the most relevant is the format argument, which allows formatting the progress bar as desired, with different types of configurations.
A complete example is shown in the following block of code, with a spinner, the bar, the completed percentage, the elapsed time and the estimated remaining time:
# install.packages("progress")
library(progress)

n_iter <- 100

pb <- progress_bar$new(format = "(:spin) [:bar] :percent [Elapsed time: :elapsedfull || Estimated time remaining: :eta]",
                       total = n_iter,
                       complete = "=",   # Completion bar character
                       incomplete = "-", # Incomplete bar character
                       current = ">",    # Current bar character
                       clear = FALSE,    # If TRUE, clears the bar when finish
                       width = 100)      # Width of the progress bar

for(i in 1:n_iter) {

    # Updates the current state
    pb$tick()

    #---------------------
    # Code to be executed
    #---------------------

    Sys.sleep(0.1) # Remove this line and add your code

    #---------------------

}
(|) [=========>---] 85% [Elapsed time: 00:00:08 || Estimated time remaining: 2s]Windows progress bar with winProgressBar function
In the previous sections we show how to create text progress bars, which will be printed in the console. However, if preferred, you can also create a Windows-style progress bar with the winProgressBar and setWinProgressBar functions.
The process for adding it is analogous to the previous examples, but in this case you can also add a title and a label. Note that if you specify a label or a title on the setWinProgressBar function, it will override the corresponding arguments of the winProgressBar function.
n_iter <- 50 # Number of iterations

pb <- winProgressBar(title = "Windows progress bar", # Window title
                     label = "Percentage completed", # Window label
                     min = 0,      # Minimum value of the bar
                     max = n_iter, # Maximum value of the bar
                     initial = 0,  # Initial value of the bar
                     width = 300L) # Width of the window

for(i in 1:n_iter) {

    #---------------------
    # Code to be executed
    #---------------------

    Sys.sleep(0.1) # Remove this line and add your code

    #---------------------

    pctg <- paste(round(i/n_iter *100, 0), "% completed")
    setWinProgressBar(pb, i, label = pctg) # The label will override the label set on the
                                           # winProgressBar function
}

close(pb) # Close the connection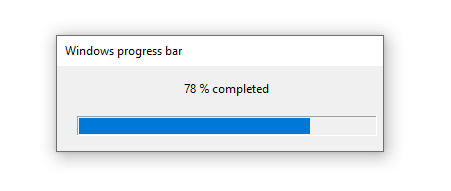
Tk progress bar (Unix-alike) with the tkProgressBar function
The function discussed on the previous subsection will only work for Windows devices. However, the tkProgressBar and setTkProgressBar functions from the tcltk package will allow you to create a Tk progress bar on Unix-alike platforms like Linux:
# install.packages("tcltk")
library(tcltk)

n_iter <- 50 # Number of iterations

pb <- tkProgressBar(title = "Tk progress bar",      # Window title
                    label = "Percentage completed", # Window label
                    min = 0,      # Minimum value of the bar
                    max = n_iter, # Maximum value of the bar
                    initial = 0,  # Initial value of the bar
                    width = 300)  # Width of the window

for(i in 1:n_iter) {

    #---------------------
    # Code to be executed
    #---------------------

    Sys.sleep(0.1)  # Remove this line and add your code

    #---------------------

    pctg <- paste(round(i/n_iter *100, 0), "% completed")
    setTkProgressBar(pb, i, label = pctg)
}

close(pb) # Close the connection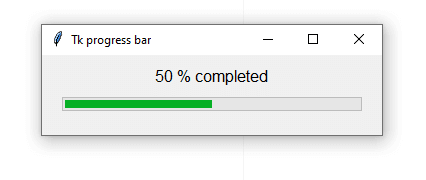
Progress bar with apply functions: ‘pbapply’ package
In the previous section we reviewed how to add progress bars to for loops, so in this section we will discuss how to use the pbapply package, which adds progress bars to the apply family functions.
The package provides the pbapply, pblapply, pbsapply, pbtapply, pbmapply and pbreplicate functions. In the following block of code we show you an example using the pblapply function, but all functions provide the same functionality.
# install.packages("pbapply")
library(pbapply)

pblapply(1:3, function(i){
            Sys.sleep(1)  # Remove this lines and add your code
             i ^ 3        # and add your code
})
|++++++++++++++++++++++++++++++++++++++++++++++++++| 100% elapsed=03s
[[1]]
[1] 1
[[2]]
[1] 8
[[3]]
[1] 27In addition, you can also customize the type of progress bar displayed with the type argument of the pboptions function. The possible values are “timer” (default), which displays a progress bar with the estimated remaining and elapsed times, “txt”, which removes the timing, “win”, which sets a Windows progress bar, “tk” for a Tk progress bar and “none”, to avoid displaying the bar.
# Save the current options
op <- pboptions()

# Setting a new bar type
pboptions(type = "win")
pbsapply(1:3, Sys.sleep)

# Back to default
pboptions(op)
There are several arguments that you can customize. As an example, you can change the character used to create the progress bar with the char argument, but type ?pboptions for additional arguments and details.
# Back to default, modifying the characater of the bar
op <- pboptions(type = "timer", char = "=")
Package ‘beepr’: sound notification when code execution ends
Finally, despite it does not provide a progress bar, the beepr package plays sound notifications with the beep function, which can very useful when you are running a long simulation study and you leave it in the background. Hence, when the code execution ends, a sound will notify you. Here’s an example used along with a progress bar:
# install.packages("beepr")
library(beepr)

n_iter <- 100

pb <- txtProgressBar(style = 3)

for(i in 1:n_iter) {

   #---------------------
   # Code to be executed
   #---------------------

   Sys.sleep(0.1) # Remove this line and add your code

   #---------------------

   setTxtProgressBar(pb, i)
}

beep(0) # Random notification

close(pb) # Close the connection
Note that beep(0) plays a random sound of the available, but you can also specify a number between 1 and 10 or “ping”, “coin”, “fanfare”, “complete”, “treasure”, “ready”, “shotgun”, “mario”, “wilhelm” or “facebook”, respectively.