Dot plot in R

A dot plot or dot chart is similar to a scatter plot. The main difference is that the dot plot in R displays the index (each category) in the vertical axis and the corresponding value in the horizontal axis, so you can see the value of each observation following a horizontal line from the label.
These graphs can also be used as an alternative to horizontal barplots. In addition, you can label the corresponding points in the vertical axis by different groups and even sort them based on some variable.
Note that there are several types of dot charts, like the classical, the Cleveland’s version and Dumbbell dot plots. In this tutorial we are going to show how to create Cleveland dot plots in R and Dumbbell charts.
The dotchart function
The dotchart function allows to create a Cleveland’s dot plot in R. Consider the following dataset, which represents the expected and actual sales for each month of some company.
set.seed(1)

month <- month.name
expected <- c(15, 16, 20, 31, 11, 6,
              17, 22, 32, 12, 19, 20)
sold <- c(8, 18, 12, 10, 41, 2,
          19, 26, 14, 16, 9, 13)
quarter <- c(rep(1, 3), rep(2, 3), rep(3, 3), rep(4, 3))

data <- data.frame(month, expected, sold, quarter)
data
month expected sold quarter
1 January 15 8 1
2 February 16 18 1
3 March 20 12 1
4 April 31 10 2
5 May 11 41 2
6 June 6 2 2
7 July 17 19 3
8 August 22 26 3
9 September 32 14 3
10 October 12 16 4
11 November 19 9 4
12 December 20 13 4You can create a dot chart in R of the sold variable passing it to the dotchart function. You can also label each data point with the labels argument and specify additional arguments, like the symbol, the symbol size or the color of the symbol with the pch, bg and pt.cex arguments, respectively.
dotchart(data$sold, labels = data$month, pch = 21, bg = "green", pt.cex = 1.5)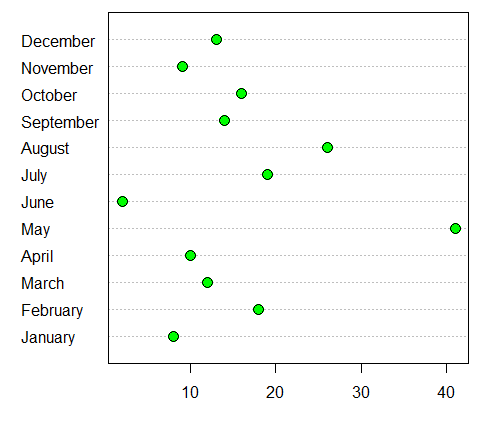
Dot plot by group in R
If you have a variable that categorizes the data in groups, you can separate the dot chart in that groups, setting them in the labels argument. You can also specify colors for each group if wanted specifying them in the color argument.
# Groups
colors <- numeric(4)
colors[quarter == "1"] <- "red"
colors[quarter == "2"] <- "blue"
colors[quarter == "3"] <- "green"
colors[quarter == "4"] <- "orange"

dotchart(data$expected, labels = data$month, pch = 19,
         pt.cex = 1.5, groups = rev(data$quarter), color = colors)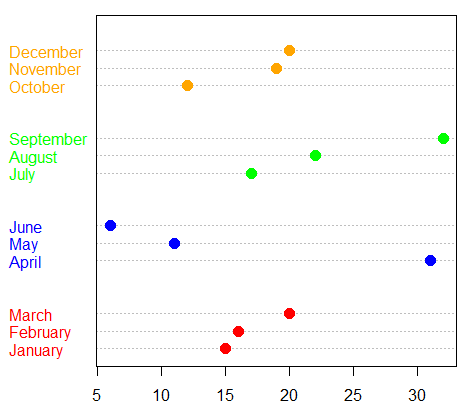
Order dotchart in R by a variable
In addition, you can order a dot plot in R by a variable if you have your data ordered. For that purpose you can type:
x <- data[order(data$expected), ]

dotchart(x$expected, labels = x$month, pch = 19,
         xlim = range(x$expected, x$sold) + c(-2, 2),
         pt.cex = 1.5, color = colors, groups = rev(data$quarter))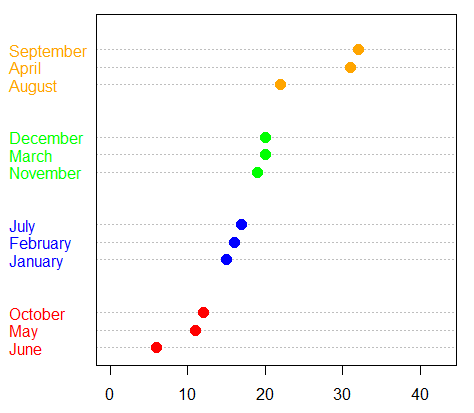
Dumbbell dot plot in R
Sometimes it is interesting to create a dot chart with two variables, representing the minimum and maximum values of some events or the change of some observations in time.
In our example, it could be interesting to represent the sold and expected variables together, to analyze the difference between the expected and actual sales. This type of dotcharts are known as Dumbbell charts or Dumbbell plots.
dotchart(data$sold, pch = 21, labels = data$month, bg = "green",
         pt.cex = 1.5, xlim = range(data$expected, data$sold) + c(-2, 2))
points(data$expected, 1:nrow(data), col = "red", pch = 19, cex = 1.5)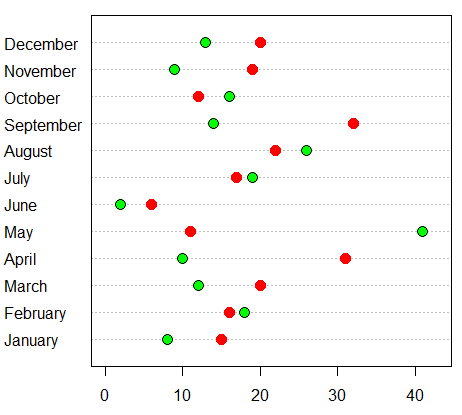
You could also add segments and texts to label the points the following way:
dotchart(data$sold, labels = data$month, pch = 21, bg = "green",
         xlim = range(data$expected, data$sold) + c(-2, 2),
         pt.cex = 1.5)

points(data$expected, 1:nrow(data), col = "red", pch = 19, cex = 1.5)

invisible(sapply(1:nrow(data), function(i) {
  segments(min(data$sold[i], data$expected[i]), i,
           max(data$sold[i], data$expected[i]), i, lwd = 2)
  text(min(data$sold[i], data$expected[i]) - 1.5, i,
       labels = min(data$sold[i], data$expected[i]))
  text(max(data$sold[i], data$expected[i]) + 1.5, i,
       labels = max(data$sold[i], data$expected[i]))
}))

points(data$expected, 1:nrow(data), col = "red", pch = 19, cex = 1.5)
points(data$sold, 1:nrow(data), col = "red", pch = 21, bg = "green", cex = 1.5)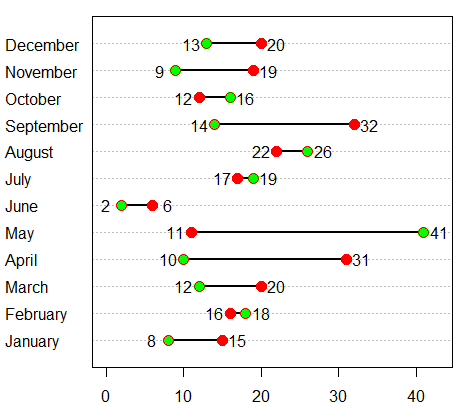
However, this is not easy to handle, and you can’t use this approach when you specify groups. As there is not any base R graphics alternative that provides this functionality, we have developed the dumbbell function, which works with grouped and ungrouped data. The arguments allow you to specify if you want to add the segments, the text, both or just the points and customize the plot as you want with the additional arguments.
# v1: numeric variable
# v2: numeric variable
# group: vector (numeric or character) or a factor containing groups
# labels: labels for the dot chart
# segments: whether to add segments (TRUE) or not (FALSE)
# text: whether to add text (TRUE) or not (FALSE)
# pch: symbol
# col1: color of the variable v1. If you want to
# add group colors add them here
# col1: color of the variable v2
# pt.cex: size of the points
# segcol: color of the segment
# lwd: width of the segment
# ... : additional arguments to be passed to dotchart function

dumbbell <- function(v1, v2, group = rep(1, length(v1)), labels = NULL,
                     segments = FALSE, text = FALSE, pch = 19,
                     colv1 = 1, colv2 = 1, pt.cex = 1, segcol = 1,
                     lwd = 1, ...) {

  o <- sort.list(as.numeric(group), decreasing = TRUE)
  group <- group[o]
  offset <- cumsum(c(0, diff(as.numeric(group)) != 0))
  y <- 1L:length(v1) + 2 * offset

  dotchart(v1, labels = labels, color = colv1, xlim = range(v1, v2) + c(-2, 2),
           groups = group, pch = pch, pt.cex = pt.cex)

  if(segments == TRUE) {
    for(i in 1:length(v1)) {
      segments(min(v2[i], v1[i]), y[i],
               max(v2[i], v1[i]), y[i],
               lwd = lwd, col = segcol)
    }
  }

  for(i in 1:length(v1)){
    points(v2[i], y[i], pch = pch, cex = pt.cex, col = colv2)
    points(v1[i], y[i], pch = pch, cex = pt.cex, col = colv1)
  }

  if(text == TRUE) {
    for(i in 1:length(v1)) {
      text(min(v2[i ], v1[i]) - 1.5, y[i],
           labels = min(v2[i], v1[i]))
      text(max(v2[i], v1[i]) + 1.5, y[i],
           labels = max(v2[i], v1[i]))
    }
  }
}
With this function you can create several combinations. Consider the example where you want to show the comparison between actual sales (blue) and expected sales (black) for each month. You could write the following:
dumbbell(v1 = data$expected, v2 = data$sold, text = FALSE,
         labels = data$month, segments = TRUE, pch = 19,
         pt.cex = 1.5, colv1 = 1, colv2 = "blue")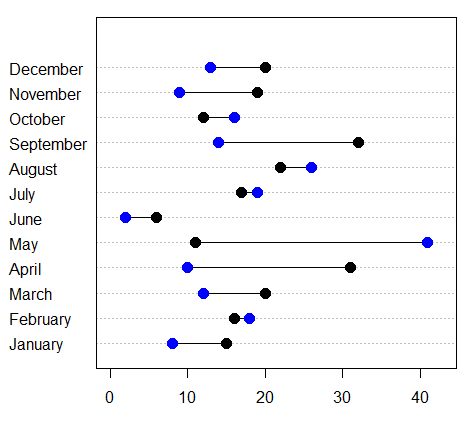
Now, if you want to divide the data in groups and also add texts with each value, you could type:
dumbbell(v1 = data$expected, v2 = data$sold, group = data$quarter,
         text = TRUE, labels = data$month, segments = TRUE, pch = 19,
         pt.cex = 1.5, colv1 = 1, colv2 = "blue")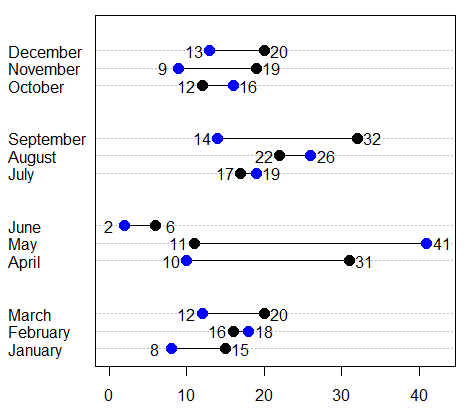
In addition, if you want to add colors for each group you can use the colv1 argument.
dumbbell(v1 = data$expected, v2 = data$sold, group = data$quarter,
         text = TRUE, labels = data$month, segments = TRUE,
         pch = 19, pt.cex = 1.5, colv1 = colors)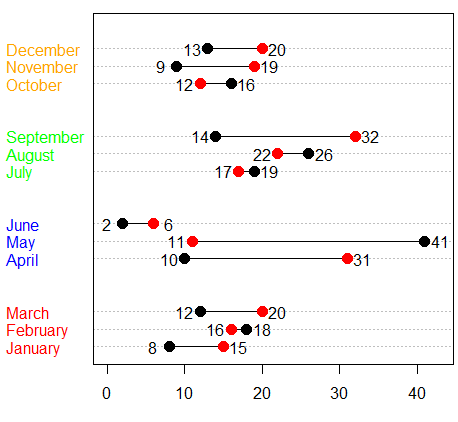
Finally, as we did in the previous section, you can also order the data for some variable:
x <- data[order(data$expected), ]

dumbbell(v1 = x$expected, v2 = x$sold, group = data$quarter,
         text = TRUE, segcol = "gray", lwd = 3, labels = x$month,
         segments = TRUE, pch = 19, pt.cex = 1.5, colv1 = 1, colv2 = "blue")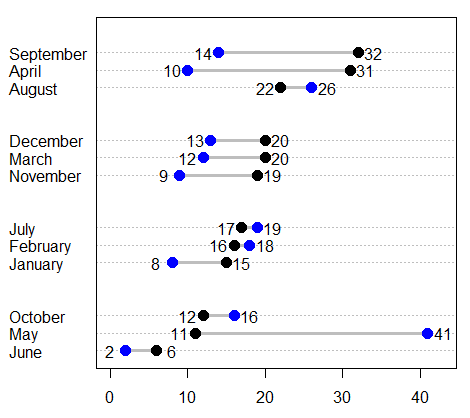
Note that the black dots are ordered in increasing order.