GRAPHS IN R
R CHARTS
Check also our specialized site in data visualization with hundreds of base R and ggplot2 examples


HOW TO CREATE R CHARTS
Graphs in R language are used to represent and understand the data you are working with. In this category you will find all the tutorials that explain how to create graphics in R, from simple to more advanced plots. In addition, there are also tutorials about how to customize the graphical parameters in order to create beautiful graphs in R, and even how to export plots in high definition, using the base R grDevices package, to be used in documents.
The three main ways to create R graphs are using the base R functions, the ggplot2 library or the lattice package:
-
Base R graphics
Thegraphicspackage is a base R package for creating graphs. Theplotfunction is the most basic function to create plots in R. With this plotting function you can create several types of plots, like line charts, barplots or even boxplots, depending on the input. -
The ggplot2 package
Theggplot2package was developed by Hadley Wickham as an implementation of the "Grammar of Graphics". This way, charts are created using a layer structure that allows you to add more elements to the chart using a simple syntax. -
The lattice package
Thelatticelibrary was created by Deepayan Sarkar and was developed as an alternative to the base R graphics tools, taking as an inspiration the Trellis graphics. This package is especially relevant when it comes to multivariate data representations.
GRAPHICS IN R PROGRAMMING LANGUAGE
There are lots of types of plots in R and the choice will depend on the objectives of your study and on your data. Hence, you can create different types of statistical representations to discover all the patterns in the observations. These representations include:
-
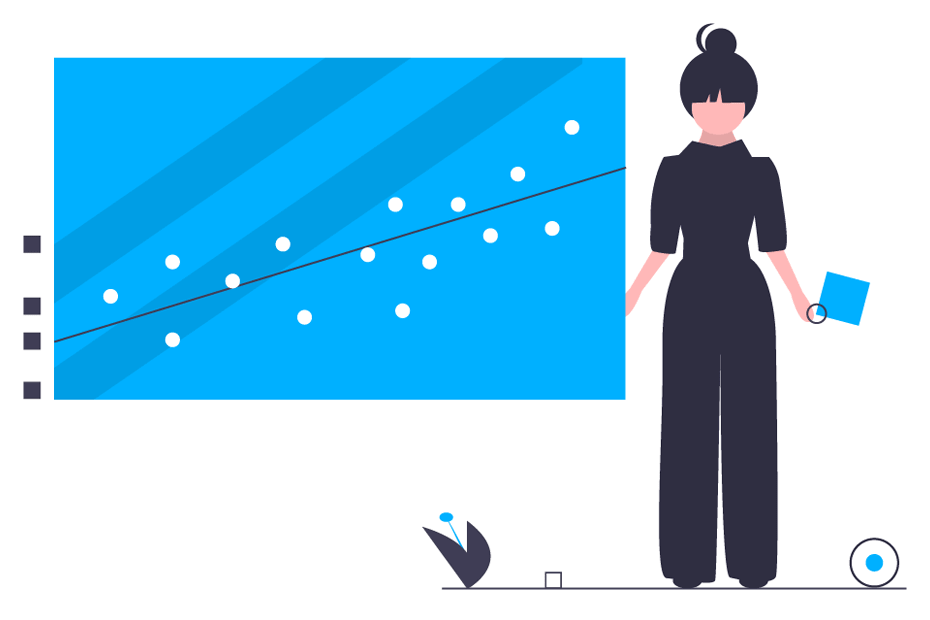
Scatter plots
Scatter plots, also known as dispersion graphs, scatter charts o scatter diagrams allows to visually check the relation between two or three variables for 3D scatter plots. If you are working with several variables you can create a pairwise comparison with a scatter matrix. -
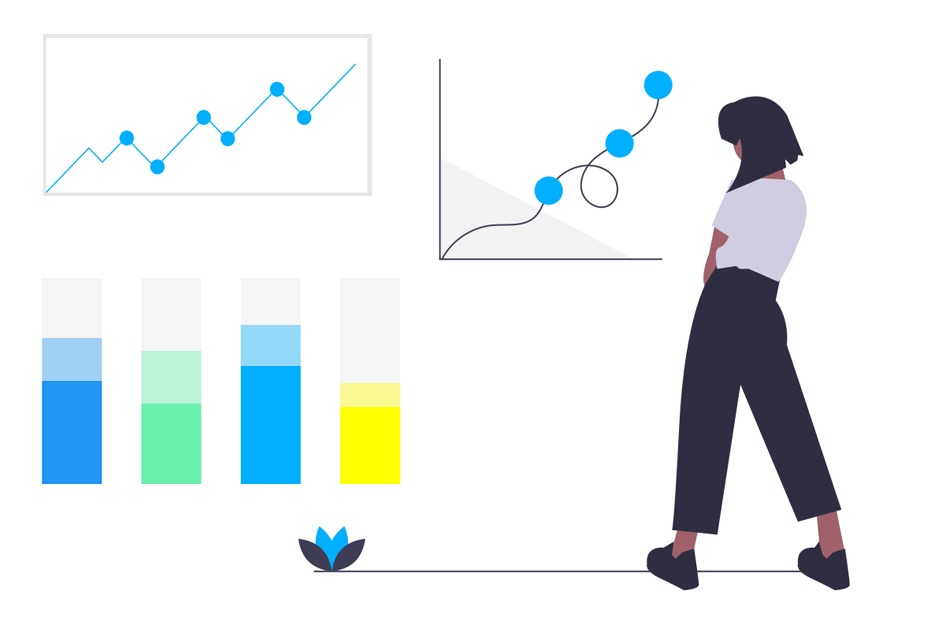
Barplots
Bar plots are a type of graph very useful to represent the count of any categorical variable. You can also create bar charts for several groups or even summarize some characteristic of a variable depending against some groups. Other related graphs for categorical data in R are spineplots or mosaicplots. -
Histograms
Histograms help to understand the underlying distribution of the data you are working with. This type of R graph can be easily created with thehistfunction. -
Density plots
Density plots are smoothed versions of the histograms using non parametric statistical techniques. -
Boxplots
Box plots are designed to represent some characteristics of the data like dispersion or skewness and also to identify outliers. The box represents the 50% of the data starting at the firs quartile and ending in the third, where the central line represents the median. -
Other plots
There are lots of graphics for representating data in addition to those previously mentioned, like dotcharts, qq-plots, beanplots among others. Navigate through the pages of this category and learn all about R graphs.