Save plot in R

When you want to export a plot to use it in a document, like a presentation or a scientific paper, you need to save the graph in a high quality resolution, as you don’t want your plots to be blurred or pixelated. In this tutorial you will learn how to save a plot in R to vector graphics and to high resolution, anti-aliased image formats.
Export plot with the menu in RStudio and R GUI
If you are using RStudio you can export a plot with the Export menu of the Plots Pane:
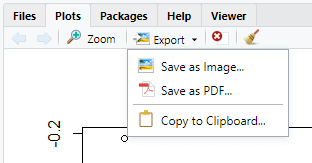
The menu allows you to select three options: save the plot as Image, as PDF or copy the plot to the Clipboard.
Save as image
If you select Save as Image… the following window will open:
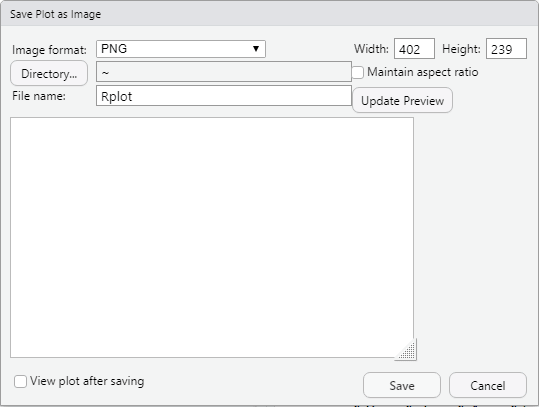
In the previous window you can select the image format to which you want to save the plot (PNG, JPEG, TIFF, BMP, Metafile, SVG, EPS), the width and height in pixels, the directory where is going to be saved and the file name.
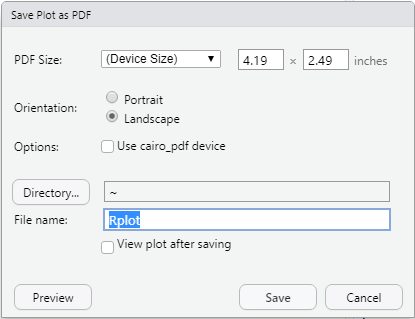
Save as PDF
If you select Save as PDF… you can select the PDF size, the orientation, the cairo graphics API, the directory and the file name.
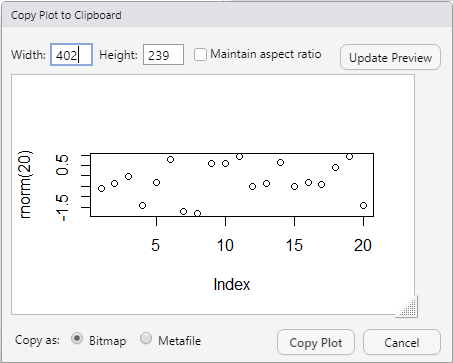
Copy to clipboard
The last option you can select is copying the image to the clipboard, as Bitmap or Metafile. You can also specify the width and the height in pixels.
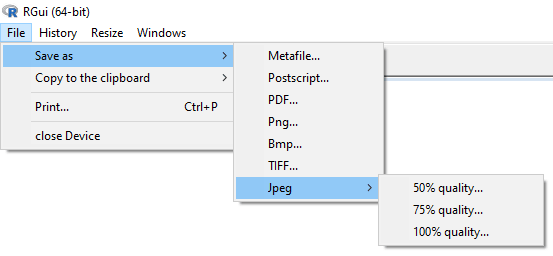
In R GUI you will need to go to File → Save as and select the type of file you prefer. If you select Jpeg, you can also specify the quality of the resulting image. The last option is copying the image to the Clipboard.
In the following sections we will review how to export plots in R with code, allowing you to fully customize the output. Recall that the first three (PDF, SVG and PS) are resolution-independent vector graphic formats, while the others are high resolution image formats.
Save plot in R as PDF, SVG or postscript (PS)
The PDF format for saving images is the most used for creating scientific documents, as they are easy to add to LaTeX and maintain the resolution even if you zoom in. However, if you need to edit the image after saving in order to add some decoration or perform some modifications you should use SVG.
First, in order to save a plot as PDF in R you will need to open the graphics device with the pdf function, create the plot you desire and finally, close the opened device with the dev.off function.
# Opening the graphical device
pdf("my_plot.pdf")

# Creating a plot
plot(rnorm(20))

# Closing the graphical device
dev.off()
You can also change the width and height (in inches) of the output plot, the paper and point size, or modify the background color, as the PDF plot will have a transparent background, or the color model, among other graphical parameters.
# Customizing the output
pdf("my_plot.pdf",         # File name
    width = 8, height = 7, # Width and height in inches
    bg = "white",          # Background color
    colormodel = "cmyk"    # Color model (cmyk is required for most publications)
    paper = "A4")          # Paper size

# Creating a plot
plot(rnorm(20))

# Closing the graphical device
dev.off()
Note that you can convert inches to centimeters dividing by 2.54.
By default, the argument paper of the pdf function is set to "special", which means that the size of the paper is defined by the specified height and width.
Recall to type ?pdf for additional information of the arguments of the function.
Second, in R you can save a plot as Scalable Vector Graphics (SVG) with the svg function. This function also allows you to modify the height, width and point size with the height, width and pointsize arguments, respectively, but also the anti-alias with the antialias argument.
# SVG graphics device
svg("my_plot.svg")

# Code of the plot
plot(rnorm(20))

# Close the graphics device
dev.off()
Note that you could open the SVG file with Adobe Illustrator, Inkscape or other similar software to edit the vector graphic as you want. Type help(svg) for further information of the arguments of the function.
Third, in order to save a plot as Postscript you can make use of the postscript function.
postscript("my_plot.ps")

# Code
plot(rnorm(20))

dev.off()
These image formats are resolution-independent. This means that you can zoom in the resulting plots without losing quality.
Save plot in R as PNG, JPEG, BMP or TIFF
The PNG, JPEG, BMP and TIFF format bitmap files graphics device functions have different common arguments, described in the following table:
| Argument | Description |
|---|---|
| width | Width (defaults to 480 pixels) |
| height | Height (defaults to 480 pixels) |
| unit | Size unit (“px”, “in”, “cm” and “mm”) |
| pointsize | Size of the plotted text |
| bg | Initial background color |
| res | Resolution in ppi |
| type |
“cairo”, “Xlib”, “quartz” (and “cairo-png” for PNG) |
| antialias | Type of anti alias |
If you set the graphic device to a high-resolution (res = 200), you will need to modify height and width of the corresponding function and the margins of your plot with the par function in order to avoid losing the original formatting and layout.
First, the png function allows you to save an image to a Portable Network Graphics file. This image file format is known to weight less than JPEG with better quality, as it supports transparent backgrounds.
# PNG device
png("my_plot.png")

# Code
plot(rnorm(20))

# Close device
dev.off()
Second, for saving plots in JPEG, you can use the jpeg function, which also allows you to set the quality of the image as percentage with the quality argument (75% by default).
# JPEG device
jpeg("my_plot.jpeg", quality = 75)

# Code
plot(rnorm(20))

# Close device
dev.off()
Third, you can save a plot to BMP (Windows bitmap) with the bmp function.
# BMP device
bmp("my_plot")

# Code
plot(rnorm(20))

# Close device
dev.off()
Last, you can save a plot to TIFF (Tagged Image File Format) with the tiff function. This function allows you to set the compression type, which defaults to "none", with the compression argument. Other options are "rle", "lzw", "jpeg", "zip", "lzw+p" and "zip+p". This argument will be ignored if type = "quartz". Type ?tiff for additional information.
# Open device
tiff("my_plot", compression = "zip")

# Make a plot
plot(rnorm(20))

# Close device
dev.off()
An alternative to save R plots from windows devices is the savePlot function
savePlot(filename = "Rplot",    # Name of the file to be saved
         type = c("wmf", "emf", "png", # Type of file to be saved
                  "jpg", "jpeg", "bmp",
                  "tif", "tiff", "ps",
                  "eps", "pdf"),
         device = dev.cur(), # Number of the device to be saved
         restoreConsole = TRUE)
Saving many plots at once in R
It is worth to mention that you can save several plots at once across multiple pages. For PDF and SVG file formats, the argument onefile defaults to TRUE, so all plots you create before closing the graphical device will be saved in the same file:
pdf("several_plots.pdf")

for(i in 1:3) {
    set.seed(i)
    plot(rnorm(20), pch = 16, col = i)
}

dev.off()
An alternative is to create several plots within a loop and name each one with a different name, so each file will be created in a separated file.
nplots <- 2

for(i in 1:nplots) {
    png(paste("Rplot_", i, ".png"))
    set.seed(i)
    plot(rnorm(20), pch = 16, col = i)
    dev.off()
}
The R dev.print function for saving plots as-is
Finally, an alternative to saving plots in R without the need of using the graphical devices is the dev.print function. This function allows you to write an image to a file as-is, so you don’t need to fine-tune all the arguments of the corresponding function. However, this is not the best practice for saving plots.
dev.print(pdf,           # Specify the type of file you prefer (svg, jpeg, ...)
          "my_plot.pdf") # Name of the file